JA8. Logistic Regression - O-Ring Damage
Statement
Observational data on O-rings from 23 shuttle missions showing the number of damaged and undamaged O-rings for each space mission is provided here: shuttlemission.csv
For this task, we are interested in modelling the probability of damage to O-ring due to the temperature.
| Dependent Variable | Independent Variable |
|---|---|
| Damaged (damage to the O-ring: 1 for damaged, 0 for undamaged) | Temperature (ambient temperature in degree Fahrenheit) |
- a. Import the data in JASP and run the logistic regression model on interest (provide a full capture of the output).
- b. Write the equation for the logistic regression based on the JASP output.
- c. Is the β estimate associated with Temperature statistically significant with a 5% significance level? Interpret.
- d. Based on the output of the logistic model, is it justified that a part of the O-rings was damaged because of temperature (Yes/No)? Interpret.
- e. Find the model-estimated probability an O-ring being damaged for the following ambient temperatures:
| Temperature (°F) | \(\hat{p}\) |
|---|---|
| 51 | |
| 53 | |
| 55 | |
| 57 |
Answer
Regression Analysis Process Using JASP
Here is a step-by-step guide on how to perform a logistic regression analysis in JASP (JASP Statistics, 2018):
- Convert the data to a CSV file:
- The data is provided as a
xlsxfile, which is not directly compatible with JASP. We need to convert it to acsvfile. - I opened the file in Excel and saved it as a
csvfile namedshuttlemission.csv.
- The data is provided as a
- Load the data into JASP:
- Use
File > Openfrom the top menu. - Select
Computerand thenBrowse. - Select the dataset file.
- Use
- Do the logistic regression analysis:
- From the JASP menu, select
Regressionand thenLogistic Regression. - Drag the dependent (outcome) variable to the
Dependent Variablebox. - Drag the independent (predictor) variable to the
CovariatesandFactorsboxes.- For categorical predictors, drag them to the
Factorsbox. - For continuous predictors, drag them to the
Covariatesbox.
- For categorical predictors, drag them to the
- Under
Statistics>Regression Coefficients, selectOdds Ratiosto get the odds ratios for the predictors. - Under
Plots, selectDisplay conditional estimates plotto get the predicted probabilities for the predictors. - Under
Statistics:- From
Performance Diagnostics, selectConfusion Matrixto get the confusion matrix. - From
Performance metrics:- Select
Sensitivitywhich describes the proportion of true positives. - Select
Specificitywhich describes the proportion of true negatives.
- Select
- From
- From the JASP menu, select
Results of the Analysis
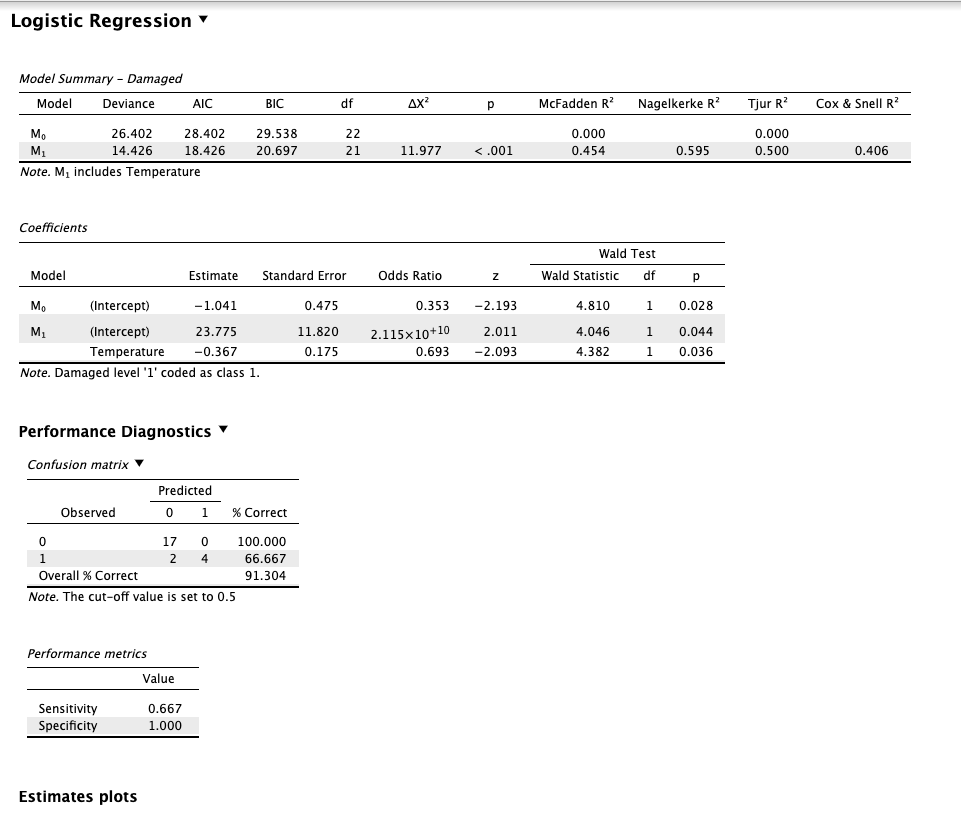
We have loaded the data into JASP and performed the logistic regression analysis. The results are as follows:
| Image 1: Logistic Regression Output |
|---|
 |
| Image 2: Logistic Regression Output (2) |
|---|
 |
A. Import the data in JASP and run the logistic regression model on interest (provide a full capture of the output)
The logistic regression model was run in JASP with the dependent variable Damaged and the independent variable Temperature. The output of the logistic regression analysis is shown in the images (Image 1 and Image 2) above.
B. Write the equation for the logistic regression based on the JASP output
Looking at the coefficients table in the output, shown in the Image 3 below:
| Image 3: Coefficients Table |
|---|
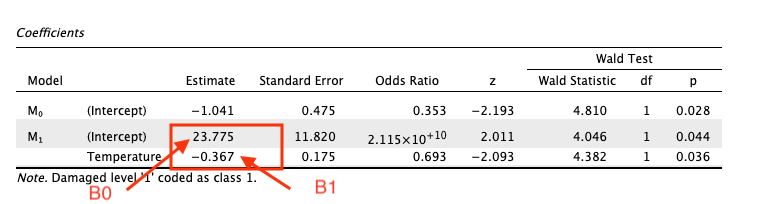 |
The general form of the regression equation is:
Where:
- \(\beta_0 = 23.775\) which is the intercept estimate of the model (M1).
- \(\beta_1 = -0.367\) which is the coefficient estimate of the
Temperaturevariable.
C. Is the β estimate associated with Temperature statistically significant with a 5% significance level? Interpret
Looking at the coefficients table in the output, shown in the Image 4 below:
| Image 4: Coefficients Table |
|---|
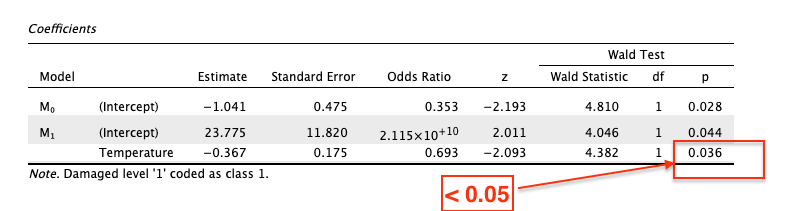 |
The p-value associated with the Temperature variable is 0.036. Since this p-value is less than the significance level of 0.05, we can conclude that the coefficient estimate \(\beta_1\) associated with Temperature is statistically significant at the 5% significance level.
D. Based on the output of the logistic model, is it justified that a part of the O-rings was damaged because of temperature (Yes/No)? Interpret
Based on the previous question, we can conclude that there is a statistically significant negatively correlated relationship between the Temperature and the probability of an O-ring being damaged. But as the coefficient is negative, it implies that as the Temperature increases, the probability of O-ring being damaged decreases (response variable is 1). Therefore, it is not justified to say that a part of the O-rings was damaged because of temperature, but rather the opposite.
E. Find the model-estimated probability an O-ring being damaged for the following ambient temperatures
And we can use the final equation to calculate the estimated probability of an O-ring being damaged for the given temperatures:
| Temperature (°F) | \(\hat{p}\) |
|---|---|
| 51 | 0.994 |
| 53 | 0.987 |
| 55 | 0.973 |
| 57 | 0.945 |
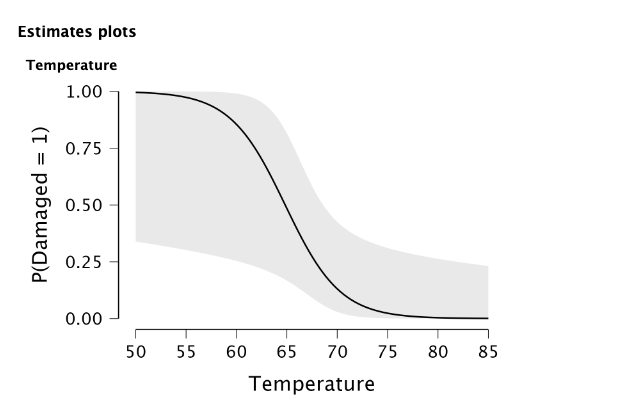
Notice that as the temperature increases, the probability of an O-ring being damaged decreases which confirms our answer to question D.
References
- JASP Statistics. (2018, February 11). How to perform a logistic regression analysis in JASP [Video]. YouTube. https://youtu.be/bUgpJeeReBY