5. Decision Trees Use Cases
Statement
Conduct research on the internet and in the University of the People library on the topic of decision trees for classification. Based upon your research, identify at least two use cases (problems or opportunities where you would use a decision tree to solve the problem) for decision trees and describe how decision tree learning could be used as a solution for the use case.
Solution
Decision Trees are such an important tool in Machine Learning, they help in classification by predicting a qualitative response; and regression by predicting a quantitative response (James et al., 2013). The text will discuss a use case for each of these two types of problems.
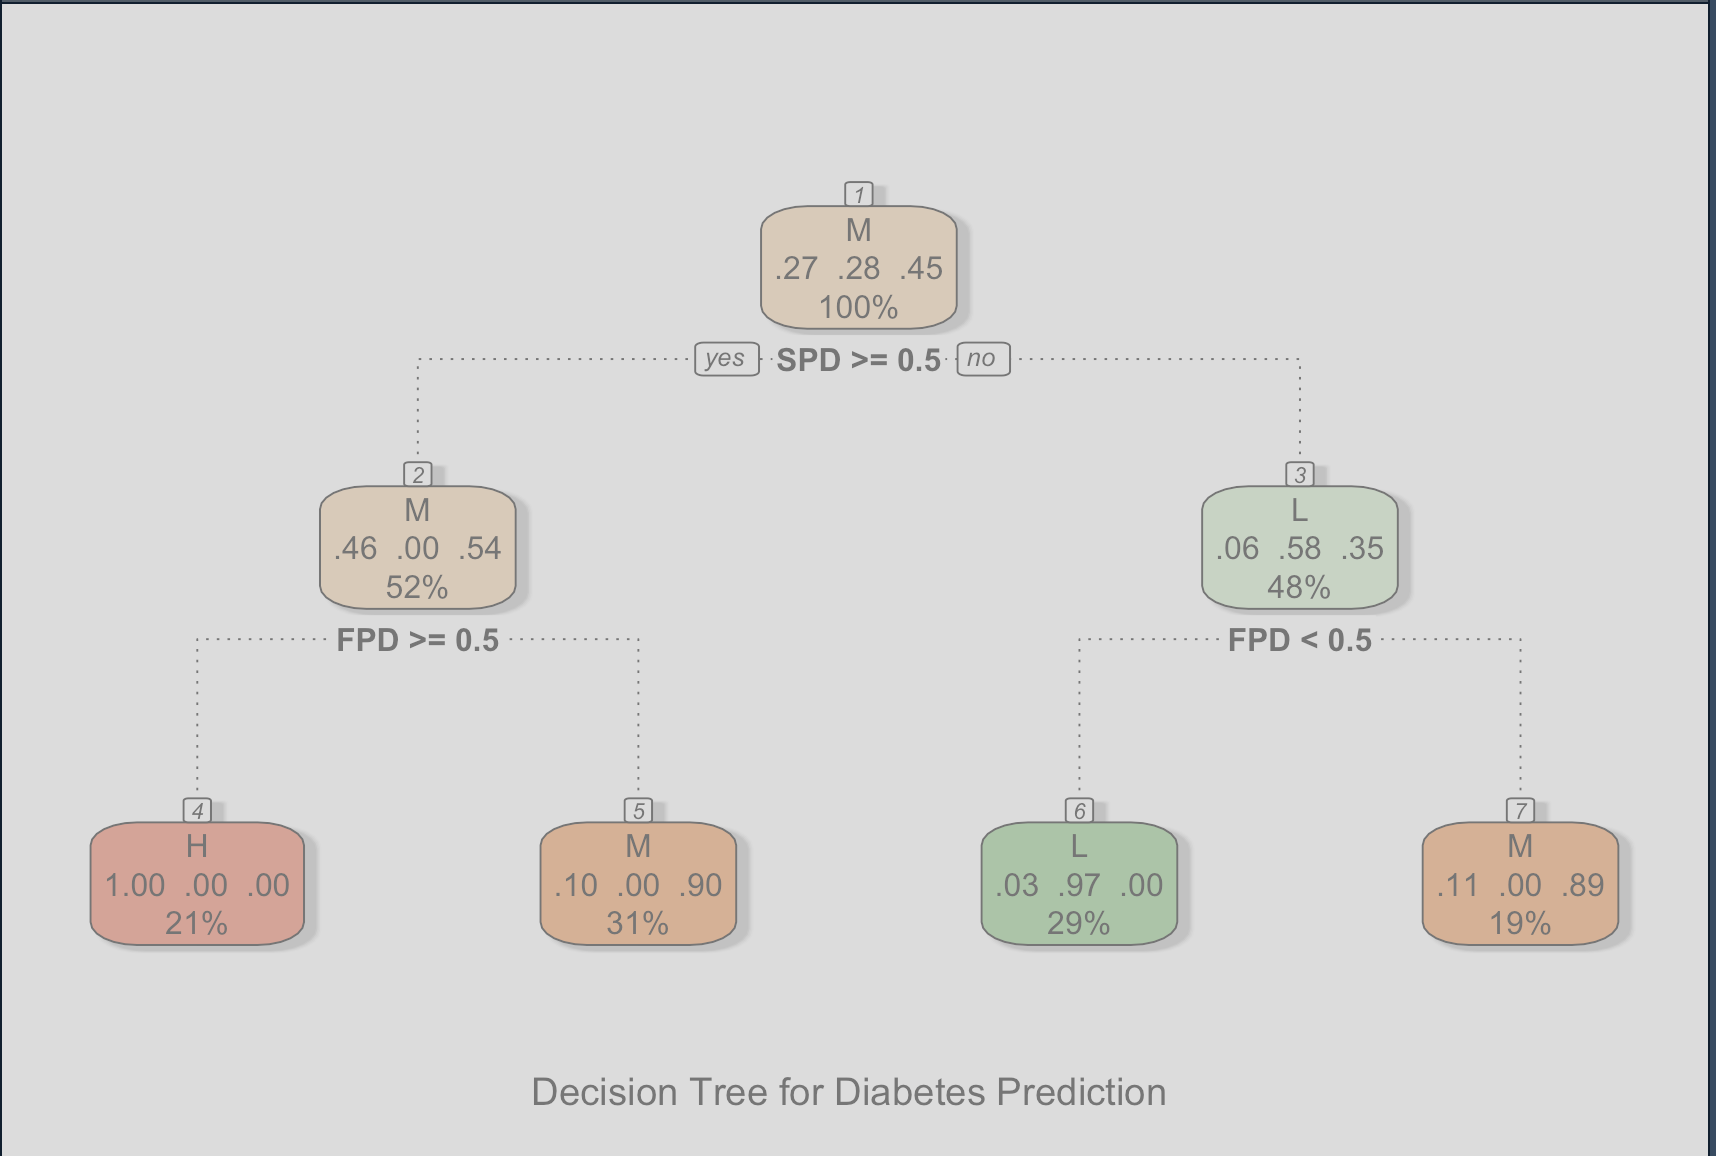
Use case 1: Categorizing people according to the possibility of them developing a diabetes
The first problem involves categorizing people according to the possibility of them developing a diabetes, either type 1 or type 2. The main purpose of such a model is to give people a warning as early as possible to take extra care and delaying the disease as much as possible.
Building such a model is complex due to the number of factors (predictors) that affects the response, but the indented model should classify the risk of developing diabetes as Low (L), Medium (M), or High (H). The predictors are: Age (A), Weight (W), First Parent diabetic (FPD), Second Parent diabetic (SPD) (to keep things simple).
The model will be built using the following data (sample):
| A | W | FPD | SPD | Response |
|---|---|---|---|---|
| 20 | 70 | 0 | 0 | L |
| 22 | 80 | 1 | 1 | H |
| 25 | 80 | 0 | 0 | L |
| 30 | 100 | 0 | 0 | M |
| 34 | 120 | 0 | 0 | M |
| 35 | 110 | 1 | 0 | H |
And the expected tree will look like this:

Below is the code to build the tree using R and the help of the rpart package according to (Gorman, 2014):
#### Install missing packages
#### uncomment the first time and then keep them commented to avoid re-installing
# install.packages("rpart")
# install.packages("rattle")
# install.packages("rpart.plot")
# install.packages("RColorBrewer")


# 1. Generating data
set.seed(111)
A <- sample(20:60, 100, replace = TRUE) # Age between 20 and 60
W <- sample(60:130, 100, replace = TRUE) # Weight between 60 and 130
FPD <- sample(TRUE:FALSE, 100, replace = TRUE) # First Parent diabetic (0 or 1)
SPD <- sample(TRUE:FALSE, 100, replace = TRUE) # Second Parent diabetic (0 or 1)

# Generate response variable, H (high), M (medium), L (low) according to some rules (for deomnstration purposes)
Response <- sapply(1:100, function(i) {
    if ((A[i] > 40 && W[i] > 120) || (FPD[i] == 1 && SPD[i] == 1)) {
        return("H")
    } else if ((A[i] > 30 && W[i] > 120) || FPD[i] == 1 || SPD[i] == 1) {
        return("M")
    } else {
        return("L")
    }
})


# 2. Building the model and decision tree
library(rpart)
data <- data.frame(A, W, FPD, SPD, Response)
model <- rpart(Response ~ A + W + FPD + SPD, data = data, method = "class")


# 3. printing the decision tree
library(rattle)
library(rpart.plot)
library(RColorBrewer)

# plot the model
fancyRpartPlot(
    model,
    palettes = c("Reds", "Greens", "Oranges"),
    caption = "Decision Tree for Diabetes Prediction"
)
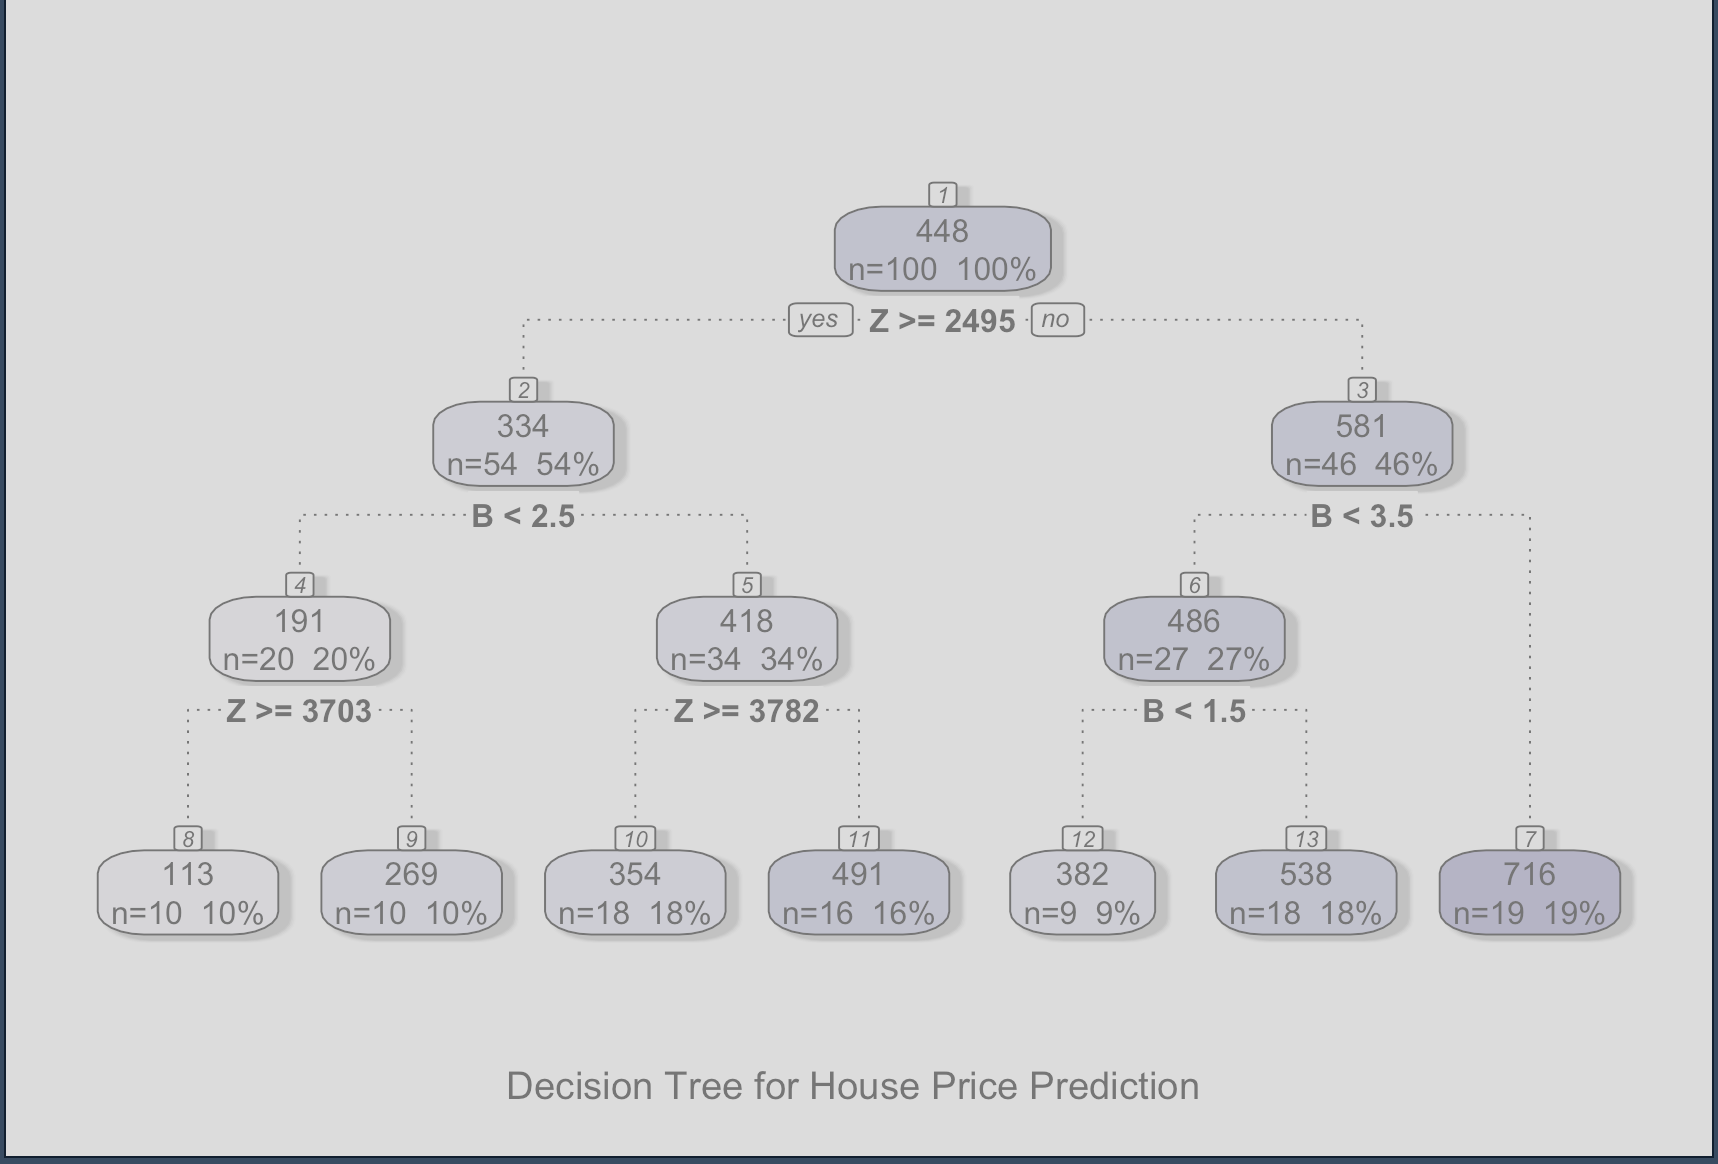
Use case 2: Predicting the price of a house
The second problem involves predicting the price of a house based on a set of predictors. The main purpose of such a model is to help people in the real estate business to estimate the price of a house based on its features.
The indented model should predict the price of a house in dollars. The predictors are: Number of bedrooms (B), Age (A), and Zip code (Z) (to keep things simple).
Considerations:
- The zip code is a categorical variable, but we will use an integer to represent it.
- The smaller the zip code, the more expensive the house (as it is closer to the city center).
- The older the house (high values for Age predictor), the cheaper it is.
- The price units are in thousands of dollars.
The model will be built using the following data (sample):
| B | A | Z | Price |
|---|---|---|---|
| 2 | 20 | 100 | 1000 |
| 3 | 30 | 90 | 1200 |
| 4 | 20 | 700 | 800 |
| 4 | 19 | 1000 | 600 |
| 1 | 10 | 1000 | 200 |
| 1 | 15 | 1200 | 180 |
And the expected tree will look like this:

And the code to build the tree using R and the help of the rpart package according to (Awati, 2016):
# 1. Generating data
set.seed(111)
B <- sample(1:5, 100, replace = TRUE) # Number of bedrooms
A <- sample(10:100, 100, replace = TRUE) # Age of the house
Z <- sample(100:5000, 100, replace = TRUE) # Zip code

# Generate response variable (Price) according to some rules
Price <- sapply(1:100, function(i) {
    base_price <- 500 + (B[i] * 100) - (A[i] * 2)
    adjusted_price <- base_price - (Z[i] / 10)
    return(adjusted_price)
})

# 2. Building the model
library(rpart)
data <- data.frame(B, A, Z, Price)
model <- rpart(Price ~ B + A + Z, data = data, method = "anova")

# 3. Printing the decision tree
library(rattle)
library(rpart.plot)
library(RColorBrewer)

# Plot the model
fancyRpartPlot(
    model,
    palettes = c("Purples"),
    caption = "Decision Tree for House Price Prediction"
)
References
- James, G., Witten, D., Hastie, T., & Tibshirani, R. (2013). An introduction to statistical learning with applications in R. New York, NY: Springer. Read Chapter 8: Tree-Based Methods, p. 303-335.
- Gorman B. (2014). Decision Trees in R using rpart. GormAnalysis. https://www.gormanalysis.com/blog/decision-trees-in-r-using-rpart/
- Awati K. (2016). A gentle introduction to decision trees using R. https://eight2late.wordpress.com/2016/02/16/a-gentle-introduction-to-decision-trees-using-r/