JA7. Learning Journal 7
1. Discuss the week’s activities and your observations
I started this week by reading the material and watching the videos. The slides from MIT were particularly complex and deep into details to the point that I could not understand fully; hence, I needed to look for external resources like YouTube. I then did the quiz and the programming assignment which was very challenging comparing to the previous one.
The topics of this week included interpolation of curves, splines, and Bézier curves. Topics also included discussions about the continuity of curves, parametric functions, and a deep dive into cubic Bézier curves (Massachusetts Institute of Technology, 2020). The programming assignment was about using what we have learned in this week to create a function graphing tool where the user enters or select a function and the tool graphs it in a 3D space.
Did anything surprise you this week?
I was surprised how complex the Bézier curves are and how they are popular and widely used in computer graphics and engineering. I was also surprised by the wide range of applications of Bézier curves in different fields such as robotics, industrial design, and medical imaging (Garofalo, 2021).
Did you face any challenges this week? How did you overcome them?
The programming assignment was very challenging as the requirements were not clear enough and has little to no guidance on where to start. After many attempts of manually creating every point in the curve, I came across the THREE.ParametricGeometry class which creates a parametric geometry based on a function. I used this class to create the curve and it worked perfectly. My assignment is available here: https://ahmad-ali14.github.io/AY2025-T2-CS4406/unit7/ and the code is available here: https://github.com/ahmad-ali14/AY2025-T2-CS4406/blob/main/src/unit7/code.ts.
The most confusing part was to generate a dynamic function that changes based on the user input and then supply it to the THREE.ParametricGeometry class. I used higher order functions as follows:
/**
 * Generates a parametric function based on the parsed function.
 * This function will be used to generate the geometry of the curve.
 */
const generateParametricFunction = (fn: ParsedFn) => {
    const parametricFunction = (u: number, v: number, target: THREE.Vector3) => {
        const x = (u - 0.5) * 2 * n; // Map u from [0, 1] to [-n, n]
        const y = (v - 0.5) * 2 * n; // Map v from [0, 1] to [-n, n]
        const z = fn(x, y);
        target.set(x, y, z);
    };
    return parametricFunction;
};

const fn = parseFunction(fnString);
const parametricFunction = generateParametricFunction(fn);
2. Discuss the application of the Bézier splines in the engineering and cartography software
Cartography is the art and science of making maps. A Map is a wide concept that includes charts, diagrams, plans, symbolizations, and other forms of information representation (Ordnance Survey, 2022). Cartography in general includes a set of tools that are considered essential for various engineering fields such as civil, mechanical, and electrical engineering. These tools are digitalized after being manually drawn on paper. Each field has a set of conventions or symbols that need to be drawn and followed on all data representations.
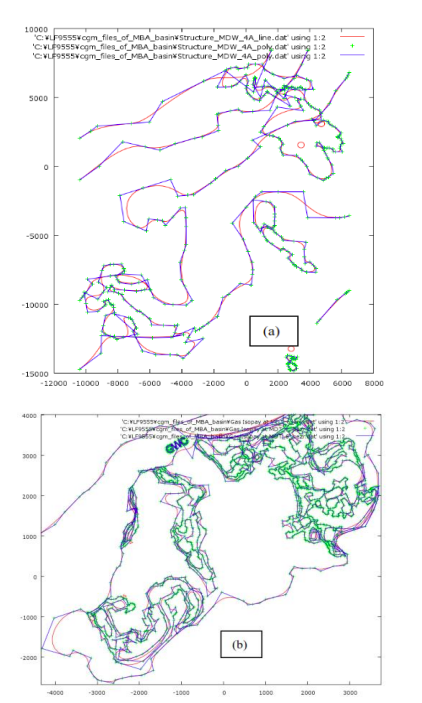
Bézier curves are a powerful tool for creating smooth curves in computer graphics. They are defined by a set of control points and a mathematical formula that calculates the actual points that make up the curve (Kamermans, 2024). They are used to create smooth curves in procedural geometry which makes them ideal for drawing symbols and conventions in cartography software (Holmer, 2021). Bézier curves are parametric curves frequently used in computer graphics, animation, modeling, CAD (Computer-Aided Design) and CAGD (Computer-Aided Geometric Design) applications. Below is an example of using Bézier curves to represent the extent of a reservoir in a GIS (Geographical Information System) map (Pal, 2013):
| Image 1: Example of using Bézier curves in GIS maps (Pal, 2013) |
|---|
 |
More uses cases of Bézier curves in engineering may include designing highways, bridges, and other road infrastructure. Industrial design is another use case such as designing cars which was the research area that gave birth to Bézier curves. Robotics is another use case where Bézier curves are used to define the path of a robot arm. Medical imaging is another use case where Bézier curves are used to draw what sensors see on a screen (Garofalo, 2021).
References
- Garofalo, E. (2021, December 3). What Are Bézier Curves in Computer Graphics? MUO; MakeUseOf. https://www.makeuseof.com/bezier-curves-computer-graphics-what/
- Holmer, F. (2021, August 19). The Beauty of Bézier Curves. YouTube. https://www.youtube.com/watch?v=aVwxzDHniEw
- Kamermans, M. P. (2024, June 19). A Primer on Bézier Curves. Github.io. https://pomax.github.io/bezierinfo/
- Massachusetts Institute of Technology (2020). Coordinates and Transformations. MITOpenCourseware. https://ocw.mit.edu/courses/electrical-engineering-and-computer-science/6-837-computer-graphics-fall-2012/lecture-notes/
- Ordnance Survey. (2022, November 14). What is Cartography? | Blog | OS. Ordnance Survey. https://www.ordnancesurvey.co.uk/blog/what-is-cartography#:~:text=What%20is%20Cartography%3F-,Cartography%20is%20often%20described%20as%20the%20art%2C%20science%2C%20and%20technology,has%20arguably%20evolved%20over%20time
- Pal, A. (2013). Bezier curves and representation of reservoir extent maps.https://spgindia.org/10_biennial_form/P177.pdf