DA2. Oil Prices and Cost of Gasoline
Statement
Gasoline “prices at the pump” go up and down and Oil “costs per barrel” go up or down, but they do so at different rates and even in opposite directions sometimes. We want to think that demand and supply controls prices where the cost of crude oil is set by the same economic conditions that determine the price of gas. What are these mismatched trends (graphs of each are shown in the following web links) telling us about how demand and supply work in the market?
- http://www.eia.gov/dnav/pet/hist/LeafHandler.ashx?n=PET&s=EER_EPMRU_PF4_Y35NY_DPG&f=A
- http://www.eia.gov/dnav/pet/hist/LeafHandler.ashx?n=PET&s=RWTC&f=A
Answer
Introduction
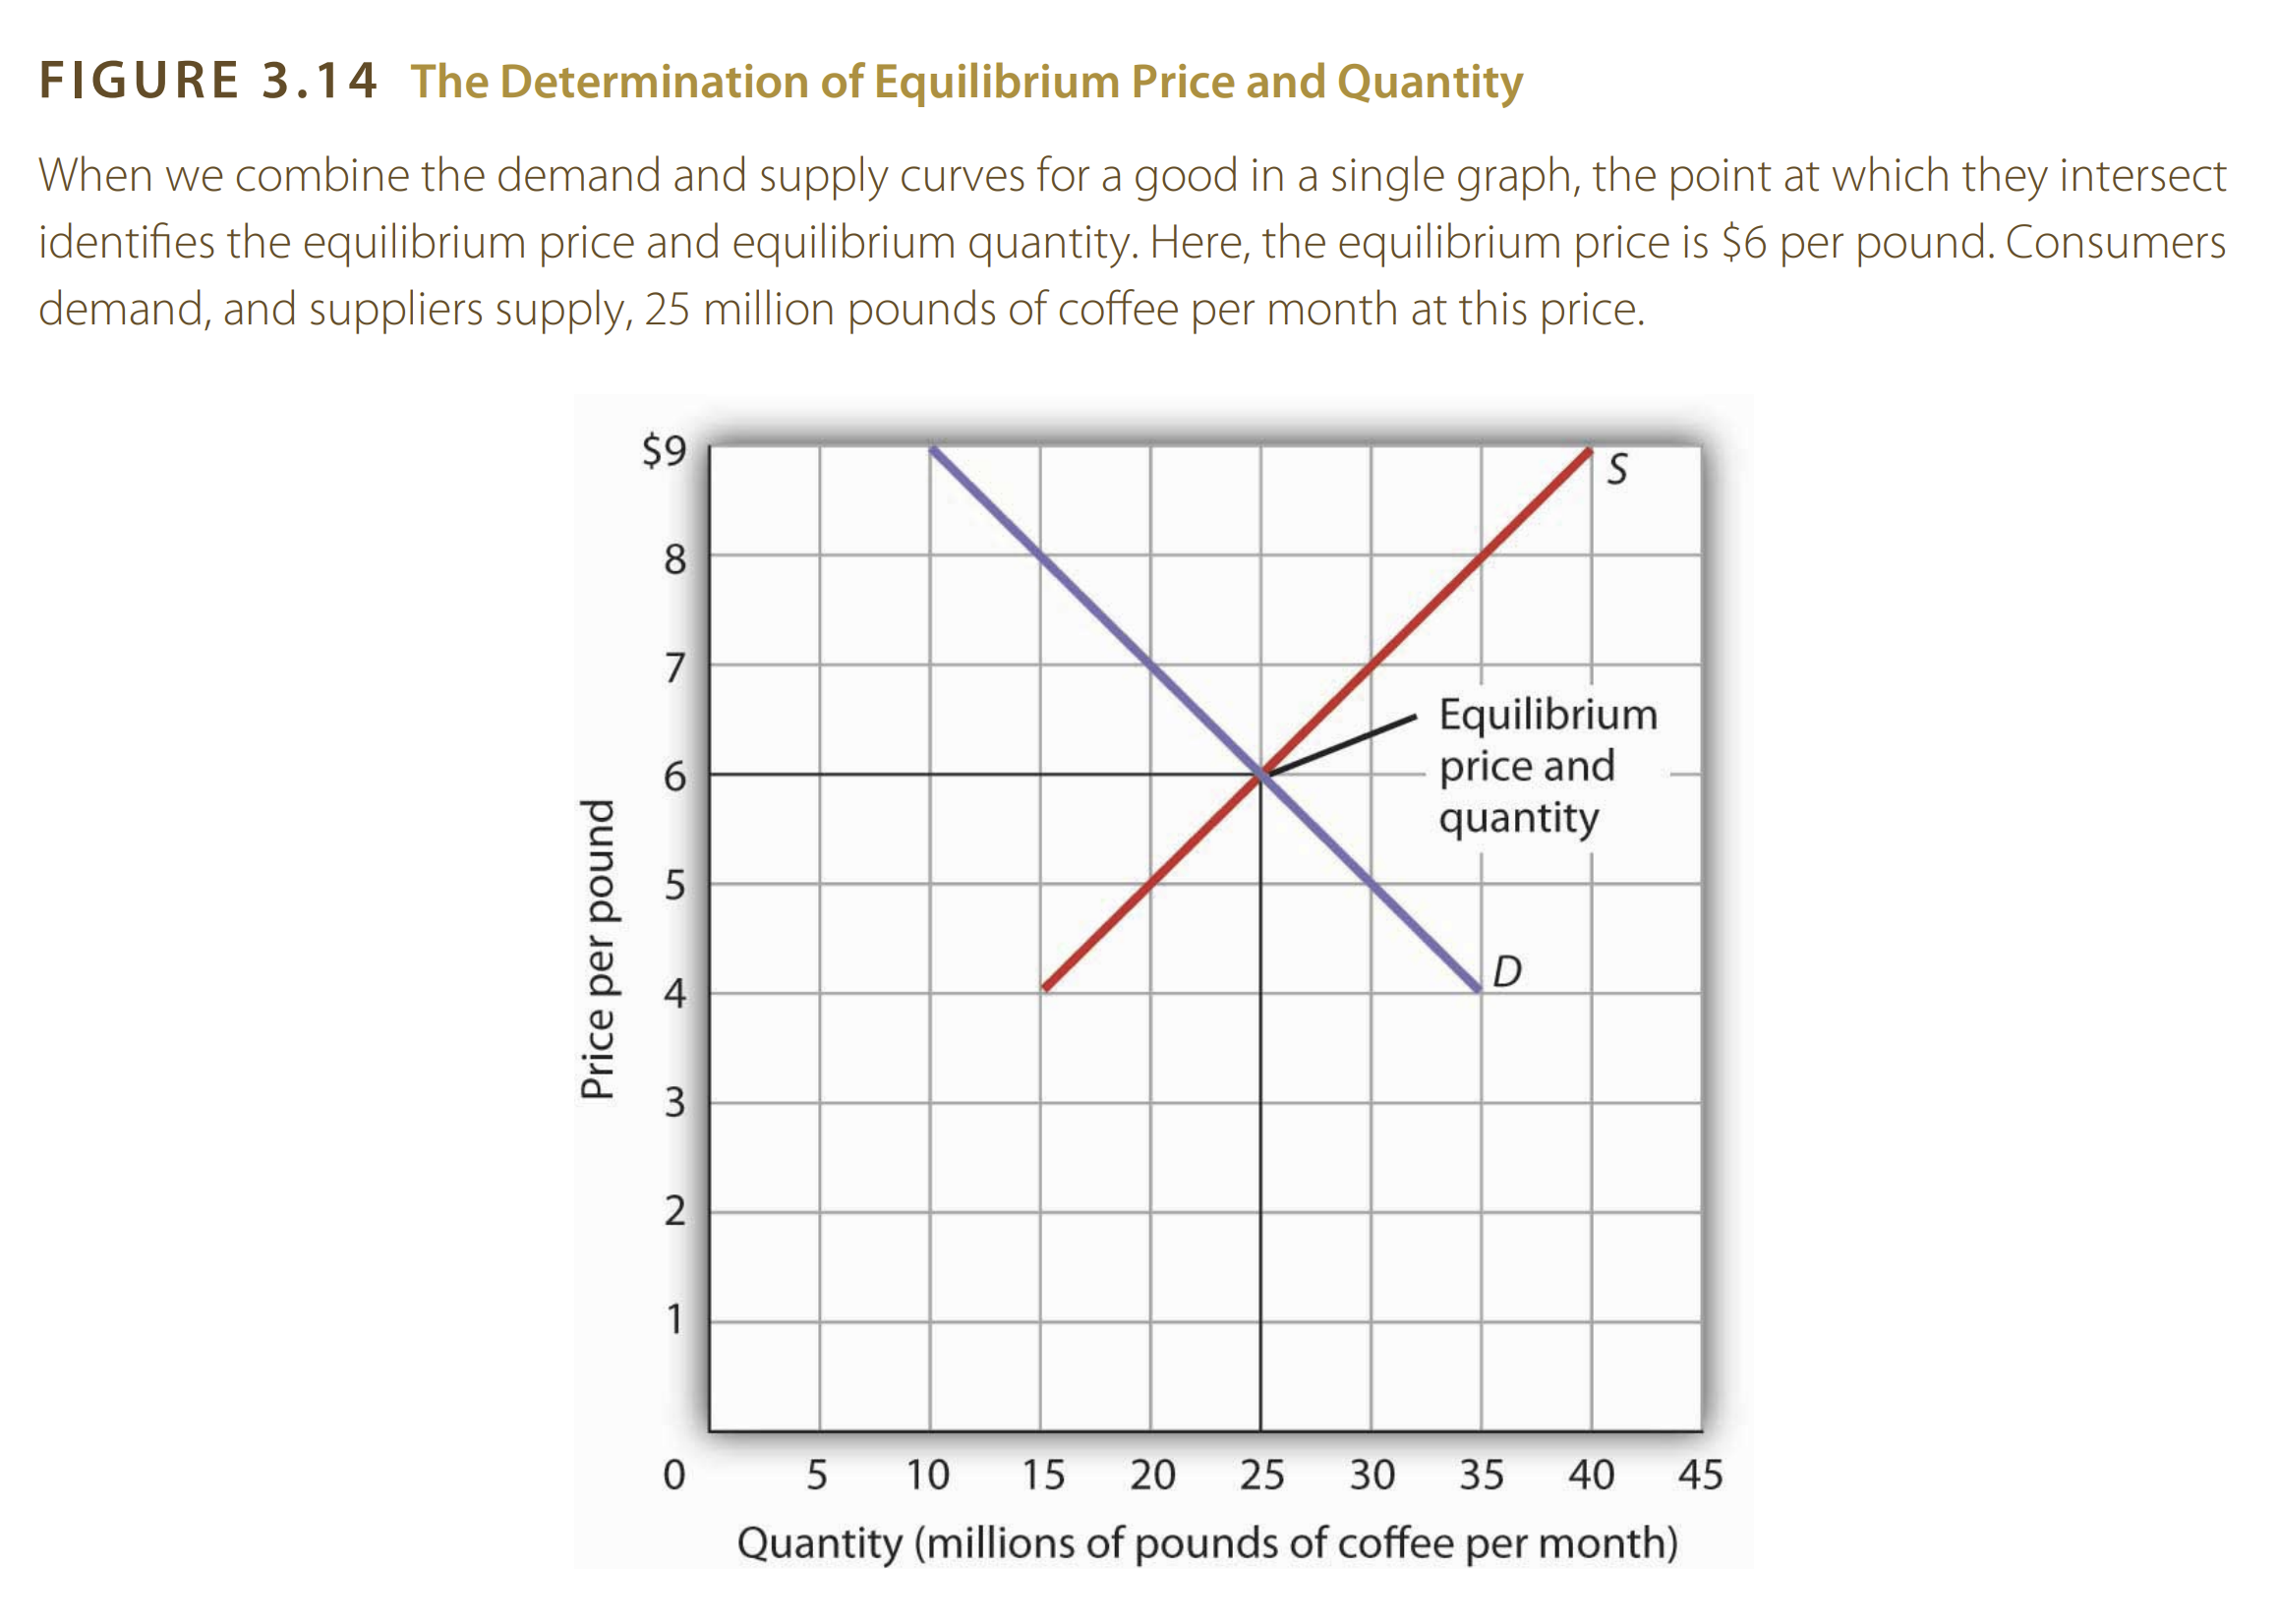
The supply and demand model explains how prices are determined in a marked. Each pillar of the model has factors that govern how the price flocculates. The model is represented by the supply and demand curve which matches the quantity of good supplied or demanded with its price as shown in Image 1. Equilibrium is reached when the quantity supplied equals the quantity demanded.
 |
|---|
| Image 1: supply and demand curve (Rittenberg & Tregarthen, 2009, p.72) |
The text will explain the demand and supply model and the determinants of quantity supplied and demanded; and then discussing supply shifters in details; and finally, putting all of this together into the context of oil prices and gasoline costs.
Understanding Demand and Supply and Their Shifts
For demand, the determinants may include customer preferences, prices of related goods, income, demographic characteristic, and buyer expectations. For supply, the determinants are grouped under the name of production costs and may include cost of factors of production, profits of alternative activities, technology, seller expectations, natural events, and number of sellers.
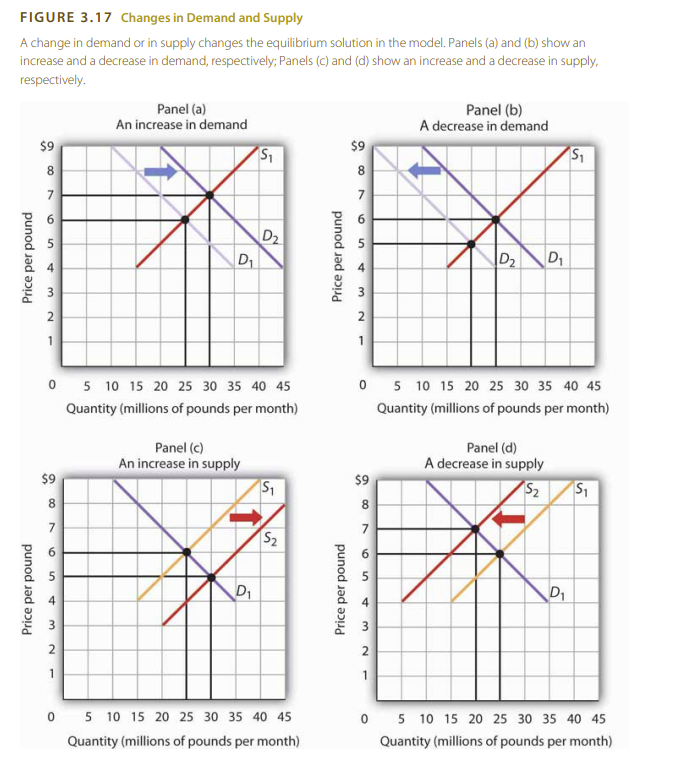
Both supply and demand affect the quantities supplied or demanded which in turn affect the price at the pump. Generally speaking, if the production cost increases, then the quantity supplied decreases and the price will increase according to case d in Image 2. If the production cost decreases, then the quantity supplied increases and the price will decrease according to case c in Image 2. Changes in demand also affect the price at the pump according to cases a and b in Image 2.
 |
|---|
| Image 2: supply and demand curve changes (Rittenberg & Tregarthen, 2009, p.75) |
Discussion on Supply Shifters
The first shifter is the prices of the factors of production which may include labor, capital, and natural resources. Any increase in the price of these factors will increase the production cost and decrease the quantity supplied. Increases come at the shape labour strikes, government regulations, and decrease in the availability of natural resources.
The second shifter is the returns from alternative activities; that is, if a new industry becomes more profitable, then more investors would shift to this industry leaving the oil industry which will decrease the quantity supplied and increase the price.
Third is the advancement in technology which may decrease the production output and make it more efficient leading to a decrease in the production cost and an increase in the quantity supplied, and thus a decrease in the price.
Fourth is the seller expectations which may include the expected future prices of oil. If the sellers expect the price to increase in the future, they may decrease the quantity supplied now and withhold some of the oil to sell it later at a higher price.
Fifth is the natural events which may include hurricanes, earthquakes, and other natural disasters that may affect the production of oil and decrease the quantity supplied and increase the price.
Finally, the number of sellers may affect the quantity supplied. If the number of sellers increases, then the quantity supplied will increase and the price will decrease, and vice versa.
Discussion on Oil Prices and Gasoline Costs
.png) |
|---|
| Image 3: (New York Harbor Conventional Gasoline Regular Spot Price FOB (Dollars per Gallon), 2020). |
.png) |
|---|
| Image 4: (Cushing, OK WTI Spot Price FOB (Dollars per Barrel), 2020). |
Image 3 shows the price of gasoline at the pump in New York Harbor, and Image 4 shows the price of oil per barrel in Cushing, Oklahoma. The two graphs show that movements is exactly the same. This means that the price of gasoline and oil are closely related, and the price at the pump is affected by the price of oil which in turn is subject to the cost of production and other factors.
We notice a huge spike in the price of both gasoline and oil between 2002 and 2008; which may be attributed to the increasing demand in china, decrease in the value of the dollar, reports about oil reserves, and the geopolitical situation in the Middle East (Cohen, 2006). Notice that those factors belong mostly to natural events and seller expectations.
We also notice a huge decrease in the price between 2014-2016; which may be attributed to advances in extracting oil from shale in the United states, the increase in the value of the dollar, and demand falls below expectations (Stocker, Baffes, & Vorisek, 2018). Notice that those factors belong mostly to technology and seller expectations.
We notice another fall in the price around 2020; which may be attributed to the COVID-19 pandemic which decreased the demand for oil and gasoline as people stayed at home and the economy slowed down, and this was a natural event.
Conclusion
The price of gasoline at the pump exactly follows the price of oil per barrel, we have seen this as the two graphs move in the same direction. Both supply and demand affect the price of oil and gasoline. Demand falls such in 2020 decreases the price of oil and gasoline. While increases in supply augmented by technology decrease the price of oil and gasoline.
There is an important point when speaking about the price of oil and gasoline, which is that the price is not entirely determined by market dynamics as the OPEC (Organization of the Petroleum Exporting Countries) has a significant influence on the price of oil especially as they control most of the supply; which means that they can artificially lower or increase the price at any time.
References
- Cohen, M. (2006). STEO Supplement: Why are oil prices so high? Eia.gov. https://www.eia.gov/outlooks/steo/special/pdf/high-oil-price.pdf
- Cushing, OK WTI Spot Price FOB (Dollars per Barrel). (2020). Eia.gov. https://www.eia.gov/dnav/pet/hist/LeafHandler.ashx?n=PET&s=RWTC&f=A
- New York Harbor Conventional Gasoline Regular Spot Price FOB (Dollars per Gallon). (2020). Eia.gov. https://www.eia.gov/dnav/pet/hist/LeafHandler.ashx?n=PET&s=EER_EPMRU_PF4_Y35NY_DPG&f=A
- Rittenberg, L. & Tregarthen, T. (2009). Principles of Economics. Flat World Knowledge. Chapter3: Demand and Supply. <https://my.uopeople.edu/pluginfile.php/1894528/mod_book/chapter/527762/PrinciplesOfEconomicsChapter03.pdf>
- Stocker M., Baffes J., & Vorisek D. (2018). What triggered the oil price plunge of 2014-2016 and why it failed to deliver an economic impetus in eight charts. World Bank Blogs. https://blogs.worldbank.org/en/developmenttalk/what-triggered-oil-price-plunge-2014-2016-and-why-it-failed-deliver-economic-impetus-eight-charts