Introduction to Machine Learning and Data Mining
Learning Objectives
- Describe the difference between Data Mining and Machine Learning.
- Describe the difference between Supervised and Unsupervised learning.
- List at least 5 different types of machine learning algorithms.
- Recognize examples of data mining and machine learning.
- Complete a simple program using R.
Introduction 1
- Learning: the acquisition of facts or information as learning, or the ability to gain knowledge and skills, or the ability to solve particular sets of problems is offered as evidence of learning.
- There is an argument that learning involves awareness and that learning is only present if there is awareness of learned processes.
-
Machine learning is a process that uses data to fit a model that can be used to solve particular problem sets and to improve its performance of those problem sets over time as more data and experience is accumulated.
- ML facilitates making a decision by trining algorithms to make decisions based on data.
- ML algorithm adjusts its response based upon the input data thus making itself capable of adjusting how it interacts with its environment. This ability to self-adjust can be defined as a form of learning.
- ML learning techniques: Supervised (inductive), Unsupervised, Reinforcement learning.
-
Data Mining is used to gain insight or knowledge from existing data. The objective of data mining is to get more value (or new value) out of a data set. To this end there are is a wide spectrum of techniques both statistical and visual that are used to provide new views or insight into a data set, like: Description, Reporting, Visualization, Prediction, Classification, Clustering, and Estimation.
- Machine learning is a
subsetof Data mining. - Concepts:
- Decision Tree: a decision support tool that uses a tree-like graph or model of decisions and their possible consequences, including chance event outcomes, resource costs, and utility.
- Neural Network: a computer system modeled on the human brain and nervous system.
Machine Learning Techniques
| Technique | Definition | Example |
|---|---|---|
| Supervised Learning | Model is trained on data where input and output are known in advance | Givin cells data, define if a cell is cancerous or not. |
| Unsupervised Learning | The output is unknown and the model is supposed to cluster data in a meaningful way. Further examination are needed on the output of such a model. | Givin cells data, define all possible types of cells. |
| Reinforcement Learning | The goal is to make the most correct decision that is possible right now and learn from the outcome. | Given cells data, decide if a cell is cancerous or not And notify if new category found |
Uses of Machine Learning
| Use Case | Description | Used Techniques | Example |
|---|---|---|---|
| Prediction | The ability to foretell output based on input. It uses | Regression | Predicting stock market. Predicting person’s likelihood to get diabetes based on risk factors. |
| Classification | Place input data into predefined categories based on set of attributes. | Supervised Learning | Classifying Emails as spam or not. |
| Clustering | Place input data into output categories that the model identifies. | Unsupervised Learning |
Data mining: A conceptual overview 2
- Data Minings :
- It is the process of identifying valid, novel, useful, and understandable patterns and correlations in data.
- Also named: knowledge extraction, information discovery, information harvesting, data archeology, and data pattern processing.
- The term “data mining” is primarily used by statisticians, database researchers, and the MIS and business communities.
- Knowledge Discovery in Databases or Knowledge Data Discovery (KDD):
- It is the overall process of discovering useful knowledge from data, where data mining is a particular step in this process.
- Steps of KDD: data preparation, data selection, data cleaning, data mining, proper interpretation of the results of data mining, and ensuring that the results derived from the data are useful.
- Data warehousing:
- It is a process involves data cleaning, data integration, and saving data in a warehouse (database or data repository).
- It is a step in data mining, but it is not required step as data can be loaded directly from transactional databases.
- Data Warehouse architectures (three main components):
- Data Acquisition software: backend software that extracts data from legacy system, transactional databases, and other sources, and then consolidates the data and summarizes them, and then loads them into the warehouse database.
- Data warehouse: a database that stores acquired data, in a format optimized for data mining. also known as the target database.
- The client software: a software that allows users to access and analyze data in the warehouse.
- Online Analytical Processing (OLAP):
- It is a software that allows users to access and analyze data in the warehouse (client software).
- It allows for complex queries on the data warehouse, and display the results in helpful ways (e.g., tables, charts, graphs, etc.).
- OLAP is a data summarization/aggregation tool, while data mining is a more in-depth analysis of the data.
- OLAP differs from normal reporting tools that it answers the why questions, while reporting tools answer the what questions (what data is there).
- OLAP can be used to verify the results of data mining.
- OLAP operations: roll-up, drill-down, slice, dice, pivot, and rotate.
- Online Analytical Mining (OLAM):
- It combines OLAP and data mining.
- People in data mining:
- Project Leader: a person who is responsible for the overall project.
- Data mining client: a person who requests the data mining project, they do not have technical knowledge.
- Data mining analyst: a person who understands the business domain and the data mining techniques, facilitates communications with the client and translate their needs into technical requirements.
- Data mining Engineer: takes requirements from the analyst and builds the data mining models.
- IT analyst: the data mining project is not isolated from the rest of the organization, so the IT analyst is responsible for integrating the data mining project with the rest of the organization’s systems.
- Data mining techniques:
- Statistical procedures: logistic regression, discriminant analysis, and cluster analysis.
- Machine learning: neural networks, decision trees, and genetic algorithms.
Data mining And machine learning
- Neural Networks (NN):
- Objects have connections between them like human brain cells.
- With the learning process, the connections between the objects change.
- Disadvantage: it has a steep learning curve, and consumes a lot of time and resources to build and train.
- Case Based Reasoning (CBR):
- Trying to solve a problem by looking at the past experiences and finding a similar problem and its solution.
- Disadvantage: Solutions worked in the past may not work in the future.
- Genetic Algorithms (GA):
- It is a search algorithm that mimics the process of natural selection, reproduction, and mutations.
- It incorporates the concept of survival of the fittest in analyzing a set of possible solutions to a problem.
- Disadvantage: solutions are hard to understand with very little expiation of why a solution was chosen.
- Decision Trees (DT):
- It is a tree-like structure that represents a set of decisions.
- Every leaf node represents a decision, and every branch represents a decision rule (or a test, or a condition).
- Disadvantage: trees are sensitive to small changes in the data, and they represent the data they trained on, so they are not good at generalizing.
- Association Rules (AR):
- It is a rule that states that if an item A occurs, then item B also occurs with a certain probability.
- It is used to find relationships between variables in large databases.
- Disadvantage: it is not good at predicting the future.
Data mining and statistics
- Descriptive visualization techniques:
- Average,measures of variations, counts, percentages, cross-tabs and correlations.
- Cluster analysis:
- It categorizes data into groups that are similar to each other (clusters).
- Clusters are internally homogeneous (members of cluster are similar) and externally heterogeneous (members of different clusters are dissimilar).
- Correlation analysis:
- Measures the strength of the relationship between two variables.
- Decides if a variable will change if another variable changes.
- Finds dependencies between variables.
- Discriminant analysis:
- Predicts membership in two or more mutually exclusive groups from a set of predictor variables, when no natural ordering of the groups is available.
- The inverse of One-Way MultiVariate Analysis of Variance (MANOVA).
- Factor analysis:
- It helps in understanding the underlying reasons for the correlation between groups of variables.
- Regression analysis:
- It is a statistical tool that uses the relation between two or more quantitative variables so that one variable (dependent variable) can be predicted from the other(s) (independent variables).
- Regression analysis comes in many flavors, including simple linear, multiple linear, curvilinear, and multiple curvilinear regression models, as well as logistic regression
- Logistic regression:
- Logistic Regression is used when the response variable is a binary or qualitative outcome.
Data mining techniques and tasks
- Summarization:
- The initial step in data analysis.
- It gives an overview of the structure of the data.
- Visualizations are used to summarize data.
- Segmentation:
- Dividing the data into groups or classes based on business criteria according to the summarization results.
- Clustering techniques, visualization and neural nets are used to segment data.
- Classification:
- It is the process of finding a model that describes and distinguishes data classes or concepts.
- Unlabeled or un-categorized data is now categorized.
- Data is now categorized in classification models.
- Discriminant analysis, decision tree, rule induction methods, and genetic algorithms are used to classify data.
- Prediction:
- It is the process of finding a model that describes and predicts future data classes or concepts.
- Regression analysis, decision trees, and neural nets are used in prediction.
- Dependency analysis:
- It is the process of finding a model that describes the dependencies between variables.
- Correlation analysis, regression analysis, association rules, case-based reasoning and visualization techniques are used in dependency analysis.
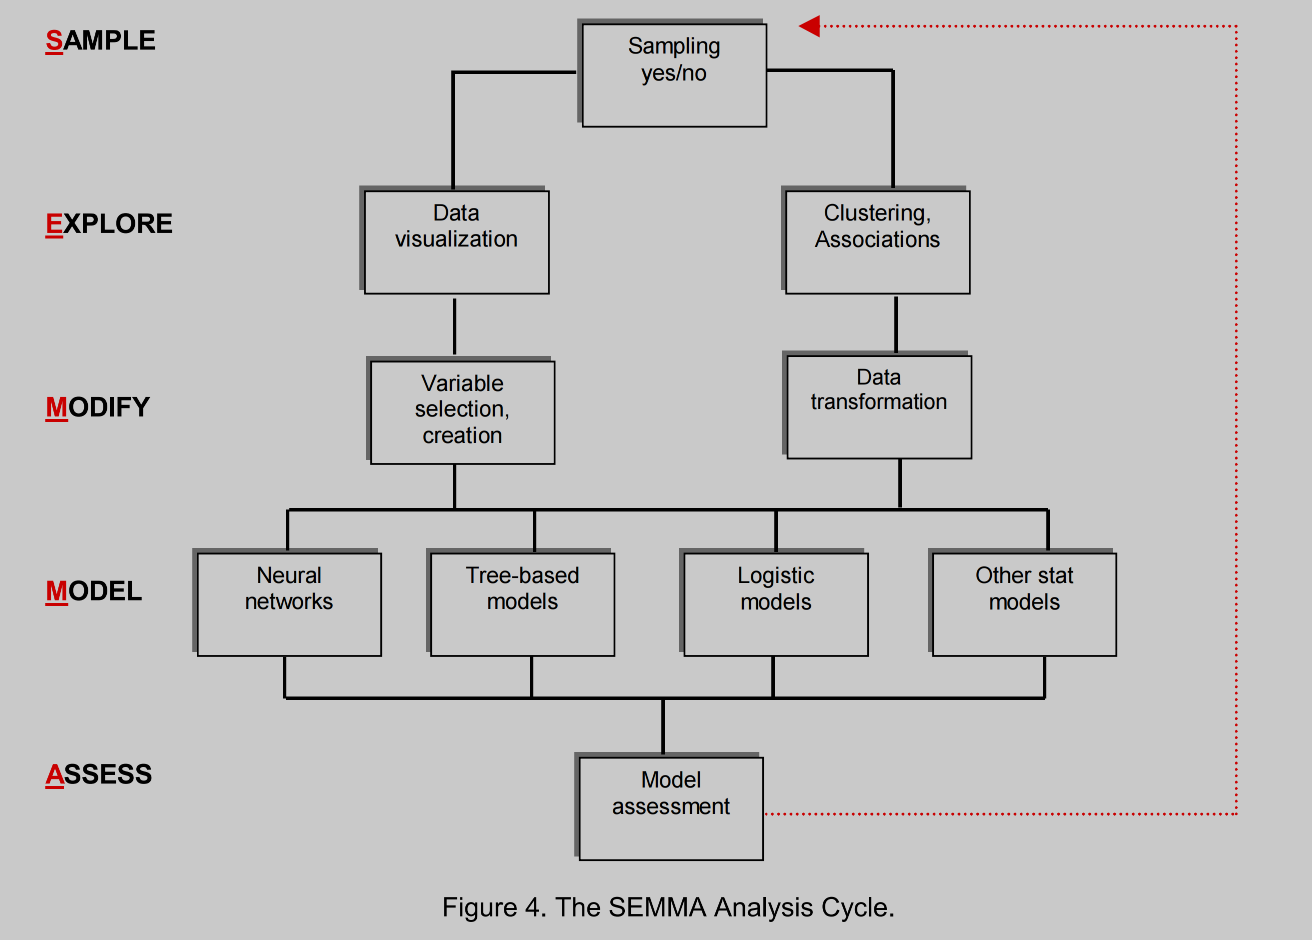
SEMMA analysis cycle
- Stands For: Sample, Explore, Modify, Model, and Assess.

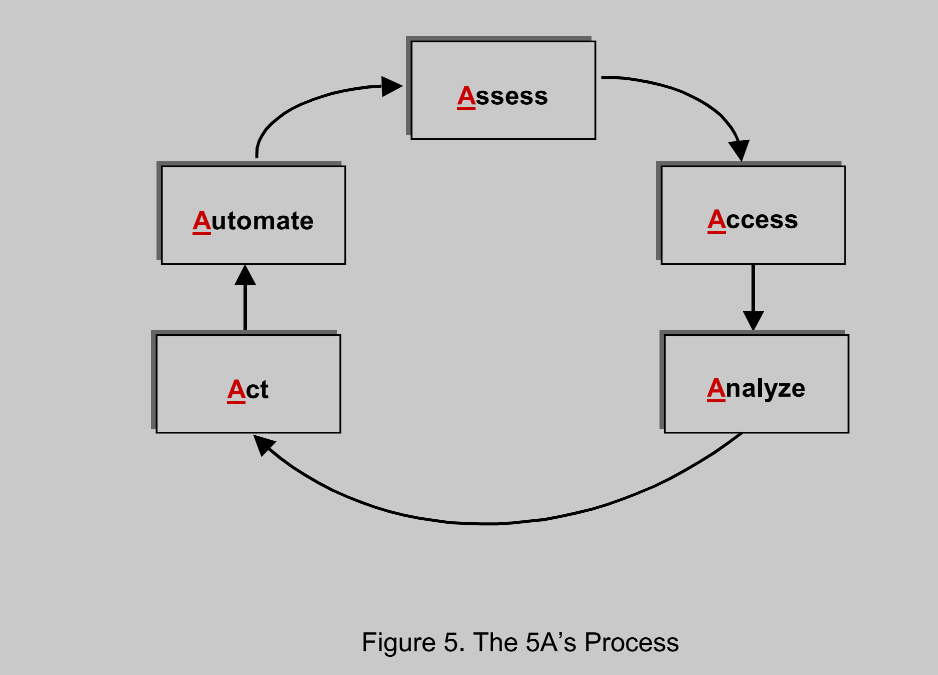
5A analysis process
- Stands For: Assess, Access, Analyze, Act, and Automate.

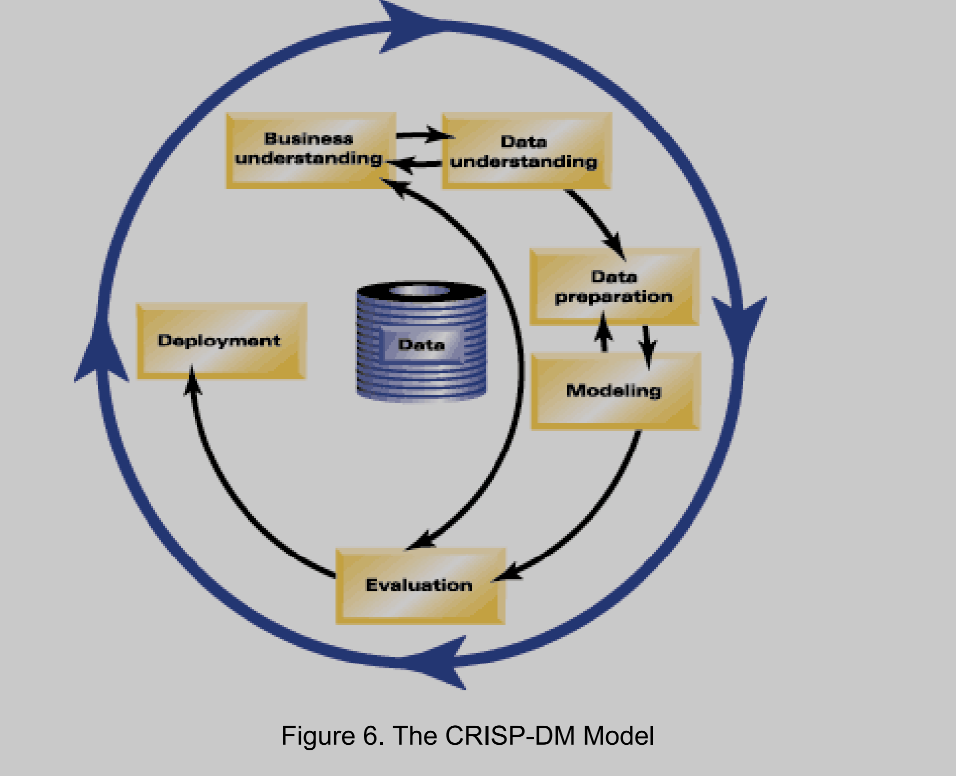
CRISP-DM analysis process
- Stands For: Cross Industry Standard Process for Data Mining.

- Steps:
- Business Understanding.
- Data Understanding.
- Data Preparation.
- Modeling.
- Evaluation.
- Deployment.
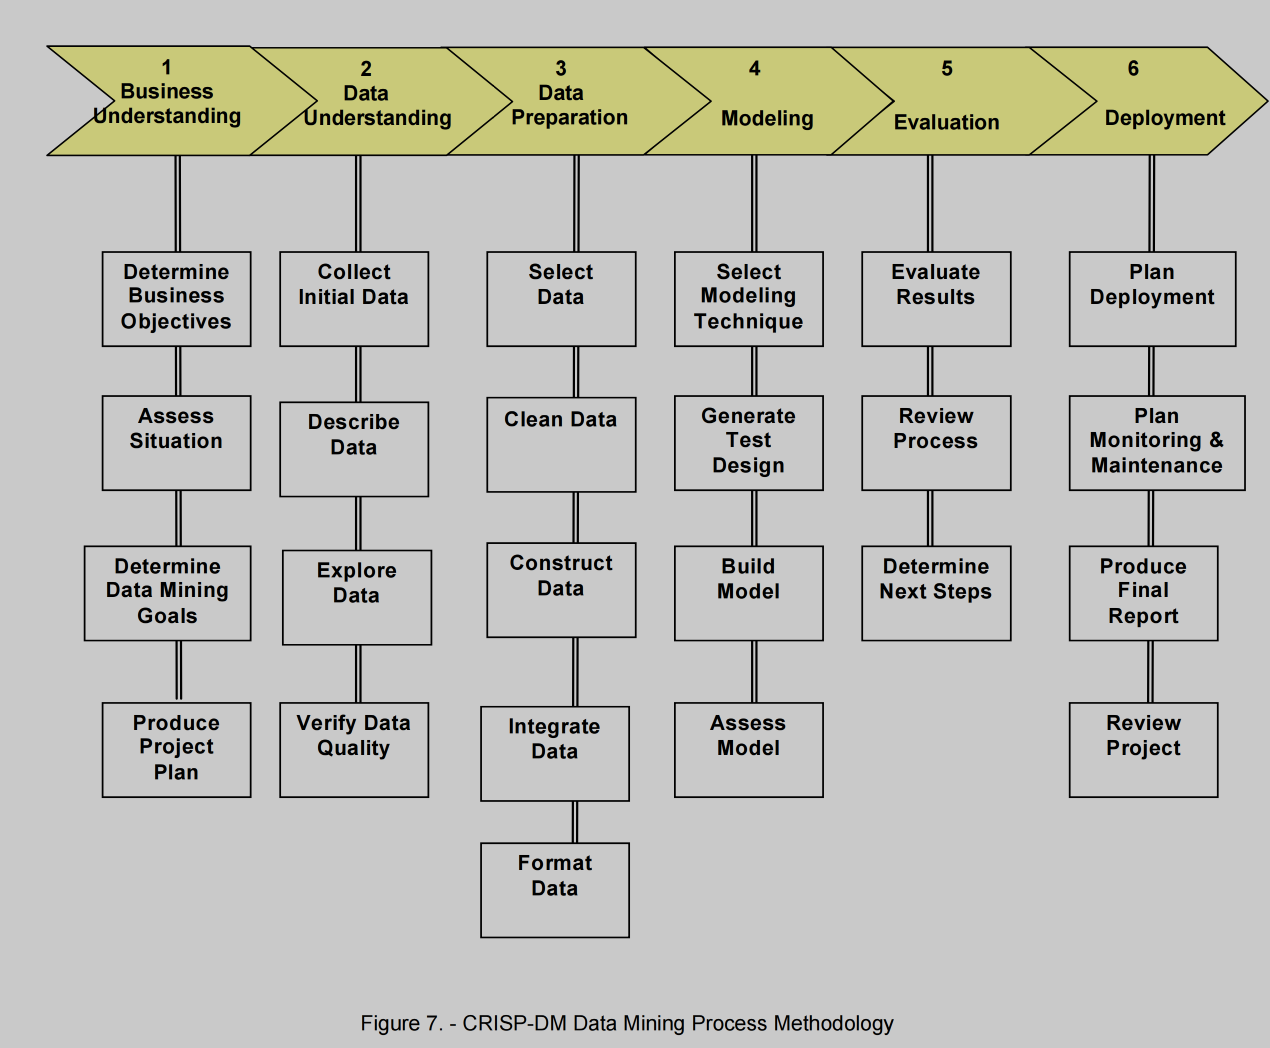
- Here are the details of each step in CRISP-DM:

- Overfitting:
- A problem happens when the model remembers its training data set and too fit for it, tha is, the model is not generalizable for new data.
- The model results are too affected by its training set, that it is affecting new general data.
- The model is coupled with its training data set.
- Two Tools to assess the models:
- Lift Chart:
- Also called Cumulative Gains Chart or banana chart.
- Measures the model performance.
- Shows how responses are affected by the model.
- Lift is the ratio of the response rate to the average response rate.
- The higher the lift from the baseline, the better the model performance is.
- Baseline is the response rate without the model (the null model).
- Confusion Matrix:
- Also called Classification Matrix.
- Assesses the predictive accuracy of the model.
- It Measures wether the model is confused or not.
- Lift Chart:
Introduction to data mining and knowledge discovery 3
- OLAP (Online Analytical Processing): is query visualizing and reporting tool connected to a database or data warehouse.
- Traditional query and report tools describe
whatis in a database. OLAP goes further; it’s used to answerwhycertain things are true. - OLAP is
deductivein nature, while data mining isinductive. - see https://aws.amazon.com/what-is/olap/
- Traditional query and report tools describe
- Data mining applications:
- Customer profiling: classify customers into groups based on their purchasing behavior.
- Cross-selling: identify products that are frequently purchased together.
- Reducing churn or attrition: identify customers who are likely to leave (based on profiling) and act to retain them.r
References
-
UoPeople. (2023). CS 4407 Introduction to machine learning. Lecture Notes. ↩
-
ackson, J. (2002). Data mining: A conceptual overview. Communications of the Association for Information Systems, 8(2002), 267-296. Available from: https://aisel.aisnet.org/cais/vol8/iss1/19/ ↩
-
Edelstein, H. A. (1998). Introduction to data mining and knowledge discovery. Available from: http://www.twocrows.com/intro-dm.pdf ↩
-
James, G., Witten, D., Hastie, T., & Tibshirani, R. (2013). An Introduction to Statistical Learning with Applications in R. New York, NY: Springer. Read Chapter 2 available from the course textbook. ↩
-
Review material in chapters 1-7 in Venable, W. N., & Smith, D. M. (2012). An Introduction to R. Html Version Available here or download the pdf at http://cran.r-project.org/doc/manuals/R-intro.pdf ↩