JA2. Changes in Demand and Supply
Statement
A supply-demand graph can be described as having a demand curve that begins in the upper left and slopes downward to the lower right; and having a supply curve that begins in the lower left and slopes upward to the upper right. Using words in a narrative, please describe and explain how both the equilibrium price and quantity will change when:
- (a) Only supply decreases
- (b) Only supply increases
- © Only demand increases
- (d) Only demand decreases
Answer
Introduction
Demand curve is a graphical representation of a demand schedule that lists the quantity of a good demanded at each price; demand quantities are usually put on the horizontal axis and prices on the vertical axis. In a similar manner, a supply curve can be constructed using the quantities supplied at every price (Rittenberg & Tregarthen, 2009).
The text will explain the concepts of the supply and demand model and then explain in detail how the changes in supply and demand affect are reflected on the curves and other factors. The text will consider the coffee market as an example.
Understanding Supply and Demand Curves
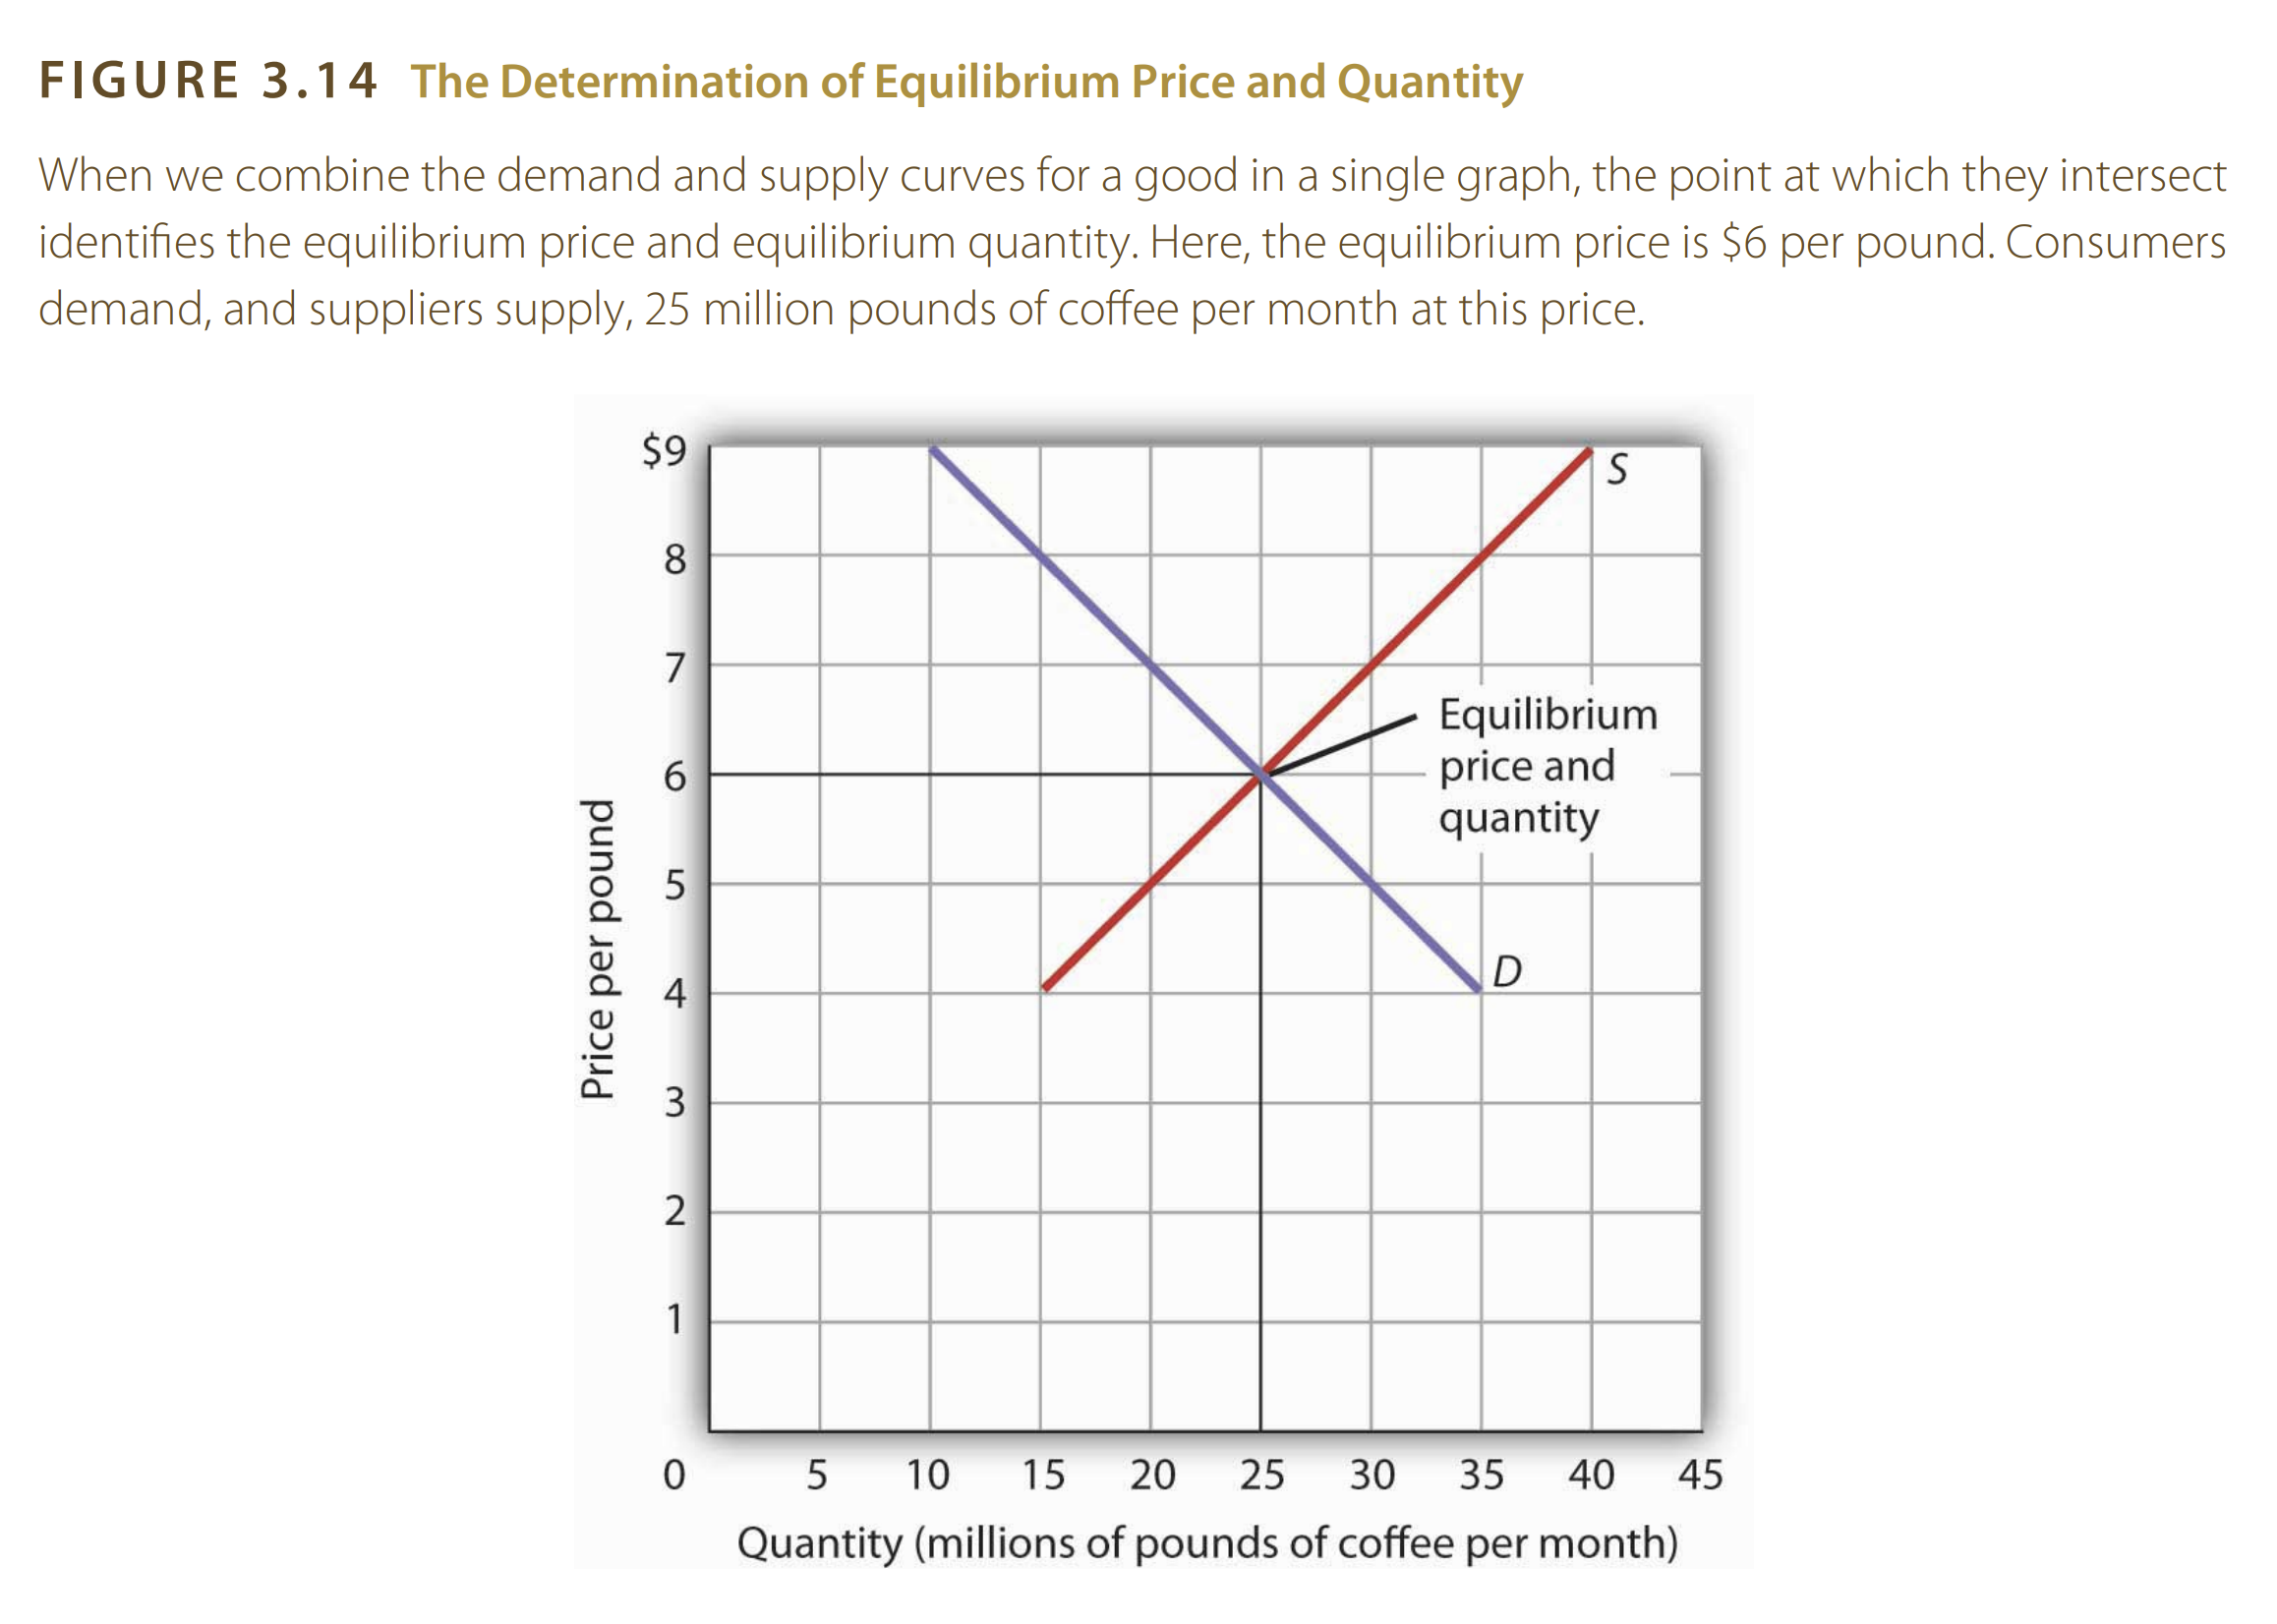
If we combine the supply and demand curves into one graph, we get the demand and supply graph which contains the two curves intersecting at a point called the equilibrium point. The equilibrium point is the point where the quantity demanded equals the quantity supplied; this point is the market stability point where the price is stable; after any change in the quantity supplied or demanded, the market will adjust itself to the equilibrium point again.
 |
|---|
| Image 1: supply and demand curve (Rittenberg & Tregarthen, 2009, p.72) |
However, a change in the demand or supply it self will shift the corresponding curve leading to a new equilibrium point with new price and quantity. Quantities supplied exceeding the equilibrium quantity will lead to surplus, and quantities demanded exceeding the equilibrium quantity will lead to a shortage. The price will adjust itself to reach the same or a new equilibrium point according to the case.
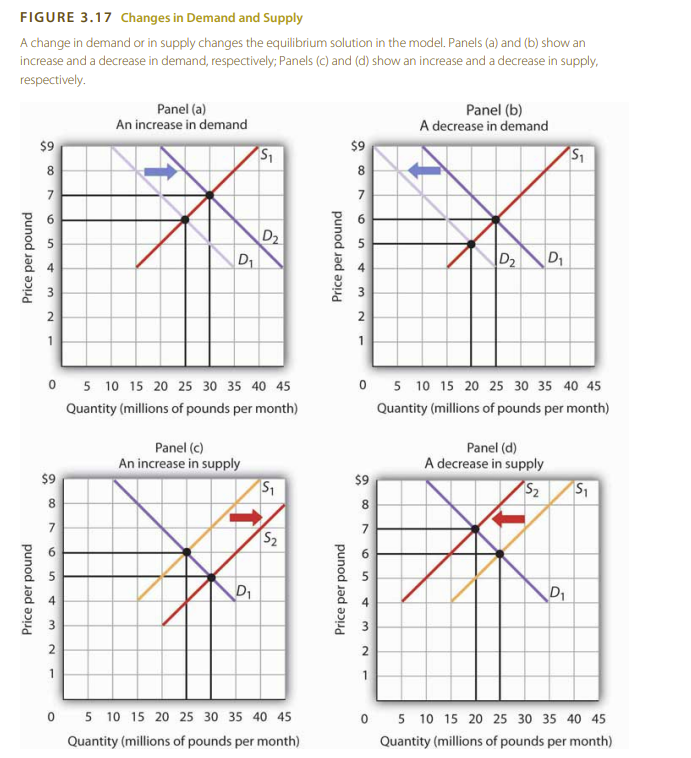
In each of our cases below, we will consider that only one of the two curves changes while all other things unchanged (ceteris paribus), and each case will create a shift in the curve and a new equilibrium point according to the table in Image 2.
 |
|---|
| Image 2: supply and demand curve changes (Rittenberg & Tregarthen, 2009, p.75) |
(a) Only Supply Decreases
The supply of coffee decreases due to events such as natural disaster that destroyed large portions of the corp for the entire year; a new regulation that puts a limit on the amount of coffee produced or transferred; sudden, prolonged, and unsolvable labor strikes; or substantial climate change that affects the growth of coffee beans.
The decrease in supply will shift the supply curve to the left according to case (d) in Image 2. The decrease in supply will create a shortage in the the market leading the price up until it reaches a new equilibrium point with a higher price and lower quantity.
(b) Only Supply Increases
The supply of coffee increases due to events such as a new technology that increases the production of coffee beans permanently; a sudden increase in the number of coffee producers; a greater harvest of coffee beans for the year; or a sudden decrease in the cost of production such as a decrease in the price of fertilizers, supply chain, or labor.
The increase in supply will shift the supply curve to the right according to case © in Image 2. The increase in supply will create a surplus in the market leading the price down until it reaches a new equilibrium point with a lower price and higher quantity.
© Only Demand Increases
The demand for coffee increases due to events such as a new study that shows huge health benefits of coffee; a new trend that makes coffee a popular drink; a sudden increase in the number of coffee shops around the city; or a sudden increase in the population of coffee drinkers such as massive migrations.
The increase in demand will shift the demand curve to the right according to case (a) in Image 2. The increase in demand will create a shortage in the market leading the price up until it reaches a new equilibrium point with a higher price and higher quantity.
(d) Only Demand Decreases
The demand for coffee decreases due to events such as a new study that shows huge health risks of coffee; a push back from the community against coffee drinkers; a sudden decrease in the number of coffee shops around the city; or a huge decrease in the prices of alternative drinks such as tea or energy drinks.
The decrease in demand will shift the demand curve to the left according to case (b) in Image 2. The decrease in demand will create a surplus in the market leading the price down until it reaches a new equilibrium point with a lower price and lower quantity.
Conclusion
We noticed four cases where the supply and demand changed heavily causing a shift in the curve and a new equilibrium point. The new equilibrium point according to each case is as follows:
| Case | Change | Price | Quantity |
|---|---|---|---|
| a | Only Supply Decreases | Up | Down |
| b | Only Supply Increases | Down | Up |
| c | Only Demand Increases | Up | Up |
| d | Only Demand Decreases | Down | Down |
In cases that do not change the supply or demand on coffee but only affects the quantities supplied or demanded, such as temporarily increased demand due to a holiday or delayed supply chain, price may change on the curve but the curve will return to its original equilibrium point after the event.
References
- Rittenberg, L. & Tregarthen, T. (2009). Principles of Economics. Flat World Knowledge. Chapter3: Demand and Supply. <https://my.uopeople.edu/pluginfile.php/1894528/mod_book/chapter/527762/PrinciplesOfEconomicsChapter03.pdf>