DA7- R2 and Adjusted R2
Statement
Think of an example from your field of interest and answer the following questions.
- Explain the difference between R2 and adjusted R2. Which one will be higher? Which one, according to you, is a better measure of the strength of a linear regression model?
- Justify your answer with relevant examples.
Answer
1. Explain the difference between R2 and adjusted R2. Which one will be higher? Which one, according to you, is a better measure of the strength of a linear regression model?.
The R^2 is an indicator to the strength of the linear fit; it describes how closely the data cluster around the regression line; it also describes the amount of variation in the response that is explained by the regression line (the model). The correlation R is computed as the sum of all the residuals (Diez, Cetinkaya-Rundel, & Barr, 2019). which has a sign that indicates the direction of the relationship between the variables (either positive or negative). But, squaring the correlation R gives the R^2 value, which is always positive.
The R^2 value ranges from 0 to 1, where 0 indicates that the model does not explain any of the variability in the response variable, and 1 indicates that the model explains all the variability in the response variable. In a simple linear regression model with one explanatory variable, the R^2 value is a good measure of the strength of the fit as bias is minimal or tolerable. However, in multiple regression models using the adjusted R^2 is more useful. Both can be computed according to the formulas below (Diez, Cetinkaya-Rundel, & Barr, 2019):
Where:
Var(e_{i})is the variance of the residuals.Var(y_{i})is the variance of the response variable.nis the number of observations.kis the number of explanatory variables.s_{residuals}is the standard deviation of the residuals.s_{response}is the standard deviation of the response variable.n-k-1is the degrees of freedom of the residuals.n-1is the degrees of freedom of the response variable.
As we see in the formulas, we are adjusting the variance of the residuals and the response variable by the degrees of freedom; this prevents using the current model from being used to predict the response of a new data; as an adjusting process is necessary (Diez, Cetinkaya-Rundel, & Barr, 2019, p.349).
The adjusted R^2 accounts for the model complexity and maximizes the accuracy of the model. It is always less than or equal to the R^2 value. The adjusted R^2 value increases only if the new variable improves the model more than would be expected by chance.
2. Justify your answer with relevant examples.
I will use the Rugby kick regression.csv dataset from the OSF database (OSF, 2024). The dataset contains the following columns: Distance, R_Strength, L_Strength, R_Flexibility, L_Flexibility, Bilateral Strength. We will do two analyses to predict the distance of a rugby kick, and compare the R^2 and adjusted R^2 values:
- The first is a simple linear regression explained by the
Bilateral Strengthvariable. - The second is a multiple regression explained by all the variables.
 |
|---|
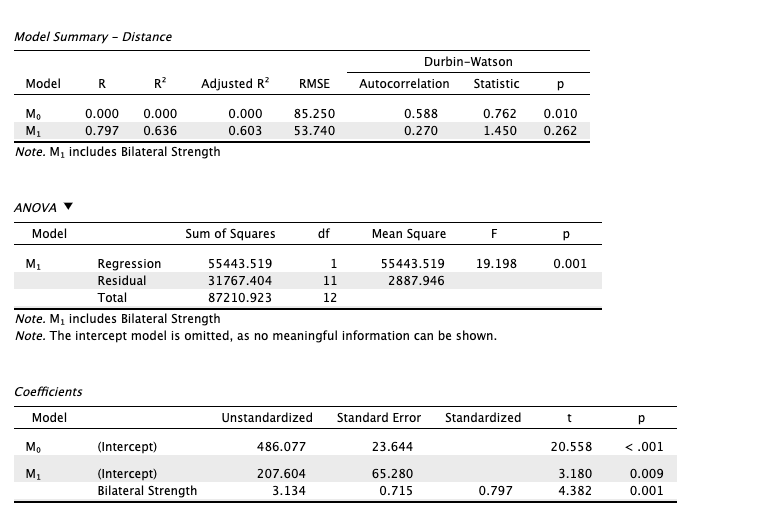
| Image 1: The results of the simple regression (Bilateral Strength only) |
The simple regression has a R^2=R^2_{adj}=0.6, which means that 60% of the distance of the kick is attributed (or explained) by the Bilateral Strength variable; notice the p-value=0.001 which means we reject the null hypothesis and accept that the distance is explained by the Bilateral Strength variable.
 |
|---|
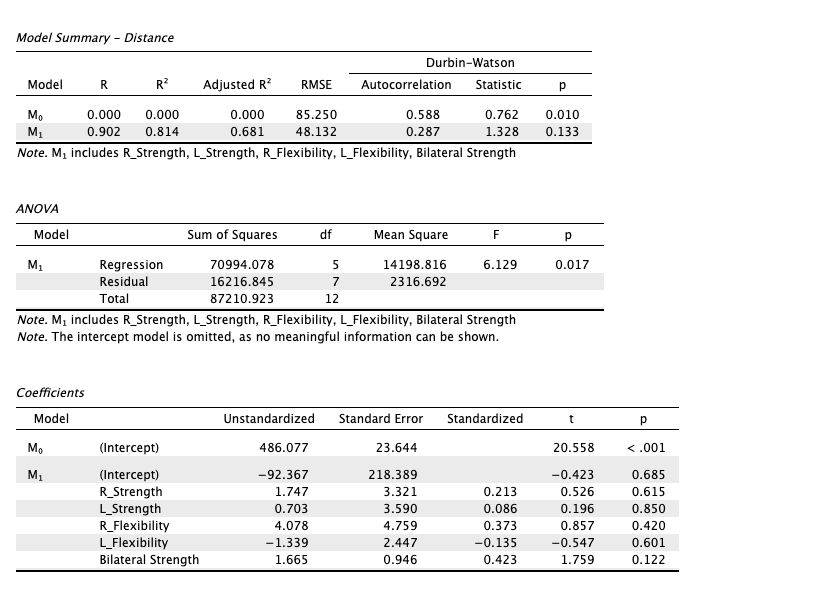
| Image 2: The results of the multiple regression (all variables included) |
The multiple regression has a R^2=0.8 and R^2_{adj}=0.6; notice the p-values for all variables (except the Bilateral strength) are very high almost >=0.6 which means they participate very little in explaining the distance of the kick. Then it is only the Bilateral Strength variable is significantly explaining the distance of the kick.
The R^2 in the multiple regression is higher than the R^2 of simple one (0.8 > 0.6) despite none of the additional variables matter; however, the R^2_{adj} is the same in both models (0.6). The difference between R^2 and R^2_{adj} in the multiple regression model indicates that adding more variables is not improving the model. This clearly shows that adjusting the R^2 value is necessary to account for the model complexity and maximize the accuracy of the model.
References
- Diez, D., Cetinkaya-Rundel, M., Barr C. D., & Barr, C. D. (2019). OpenIntro statistics - Fourth edition. Open Textbook Library. https://www.biostat.jhsph.edu/~iruczins/teaching/books/2019.openintro.statistics.pdf
- OSF. (2024). Rugby kick regression.csv. Osf.io. https://osf.io/gw7ru