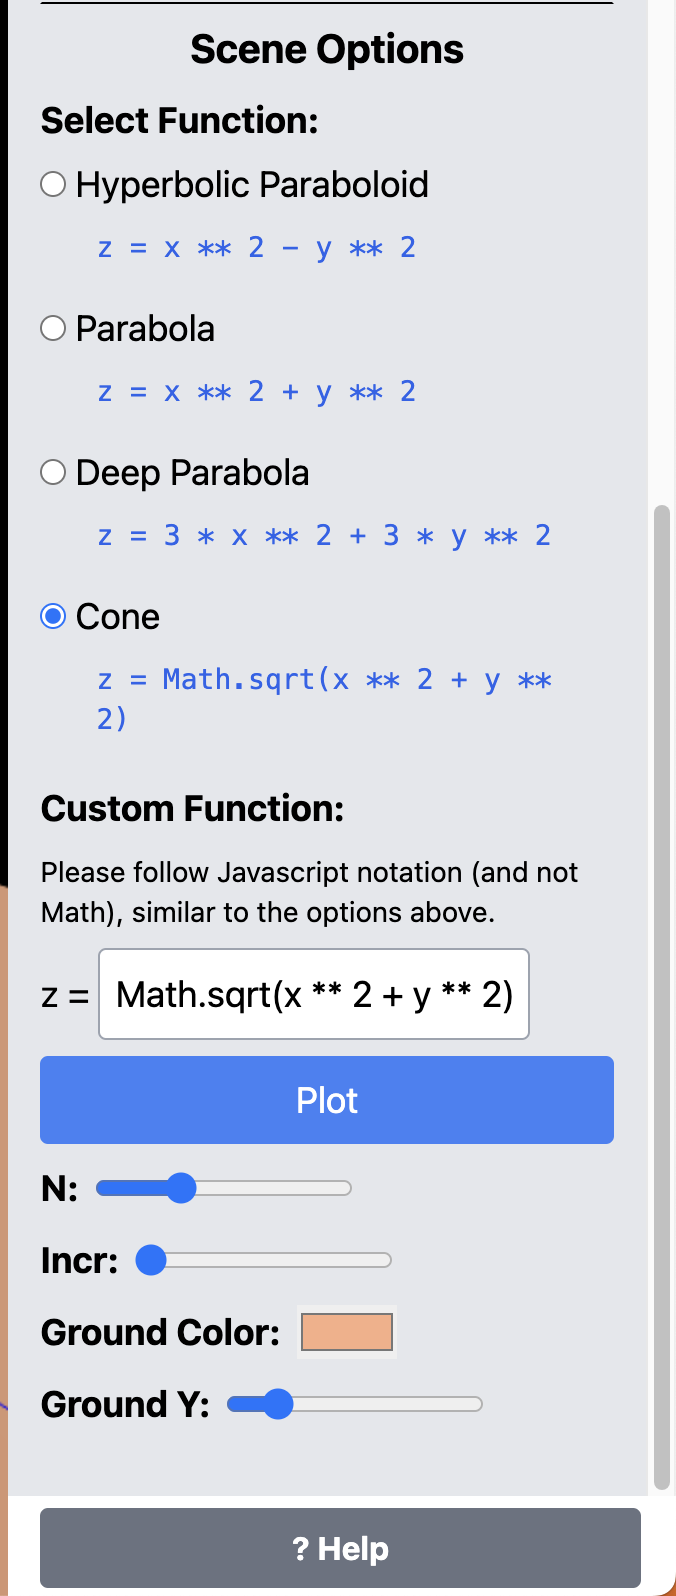
For the unit 7 Programming Assignment, we will implement a function grapher. Essentially you must create a program that can plot a function that is in the form z=f(x,y). Your program must:
Generate input values between -1 and 1 in increments of .1 (one-tenth) and use this to plot x, y, and z vertices to be included as part of a mesh that will then be graphically displayed.
Implement mouse controls such that the function that you have mapped can be rotated and scaled using the mouse.
Include a plane and an axis helper to provide a point of reference for your function that indicates the origin, which is assumed to be x=0, y=0, and z=0.
You must capture all of the vertices you define and provide them as input into one of the geometry functions within Three.js. The ParametricGeometry object is perhaps the best one to use. However, if your research identifies another approach feel free to use it as long as you can achieve the same results.
Grading Criteria
Does the assignment demonstrate the ability to graph a given function? (Yes/No)
Does the assignment include one of the specified formulas or does it allow the user to enter the formula? (Yes/No)
Can the user rotate and scale the graphed function? (Yes/No)
Was an Axis helper included in the scene (the object that indicates the x, y, and z dimensions)? (Yes/No)
Was a plane (either solid or wireframe) perpendicular to the object at the origin included? (Yes/No)
Was the JavaScript / Three.js code well documented (Scale of 1-4 where 1 is no comments and 4 is comprehensive comments)
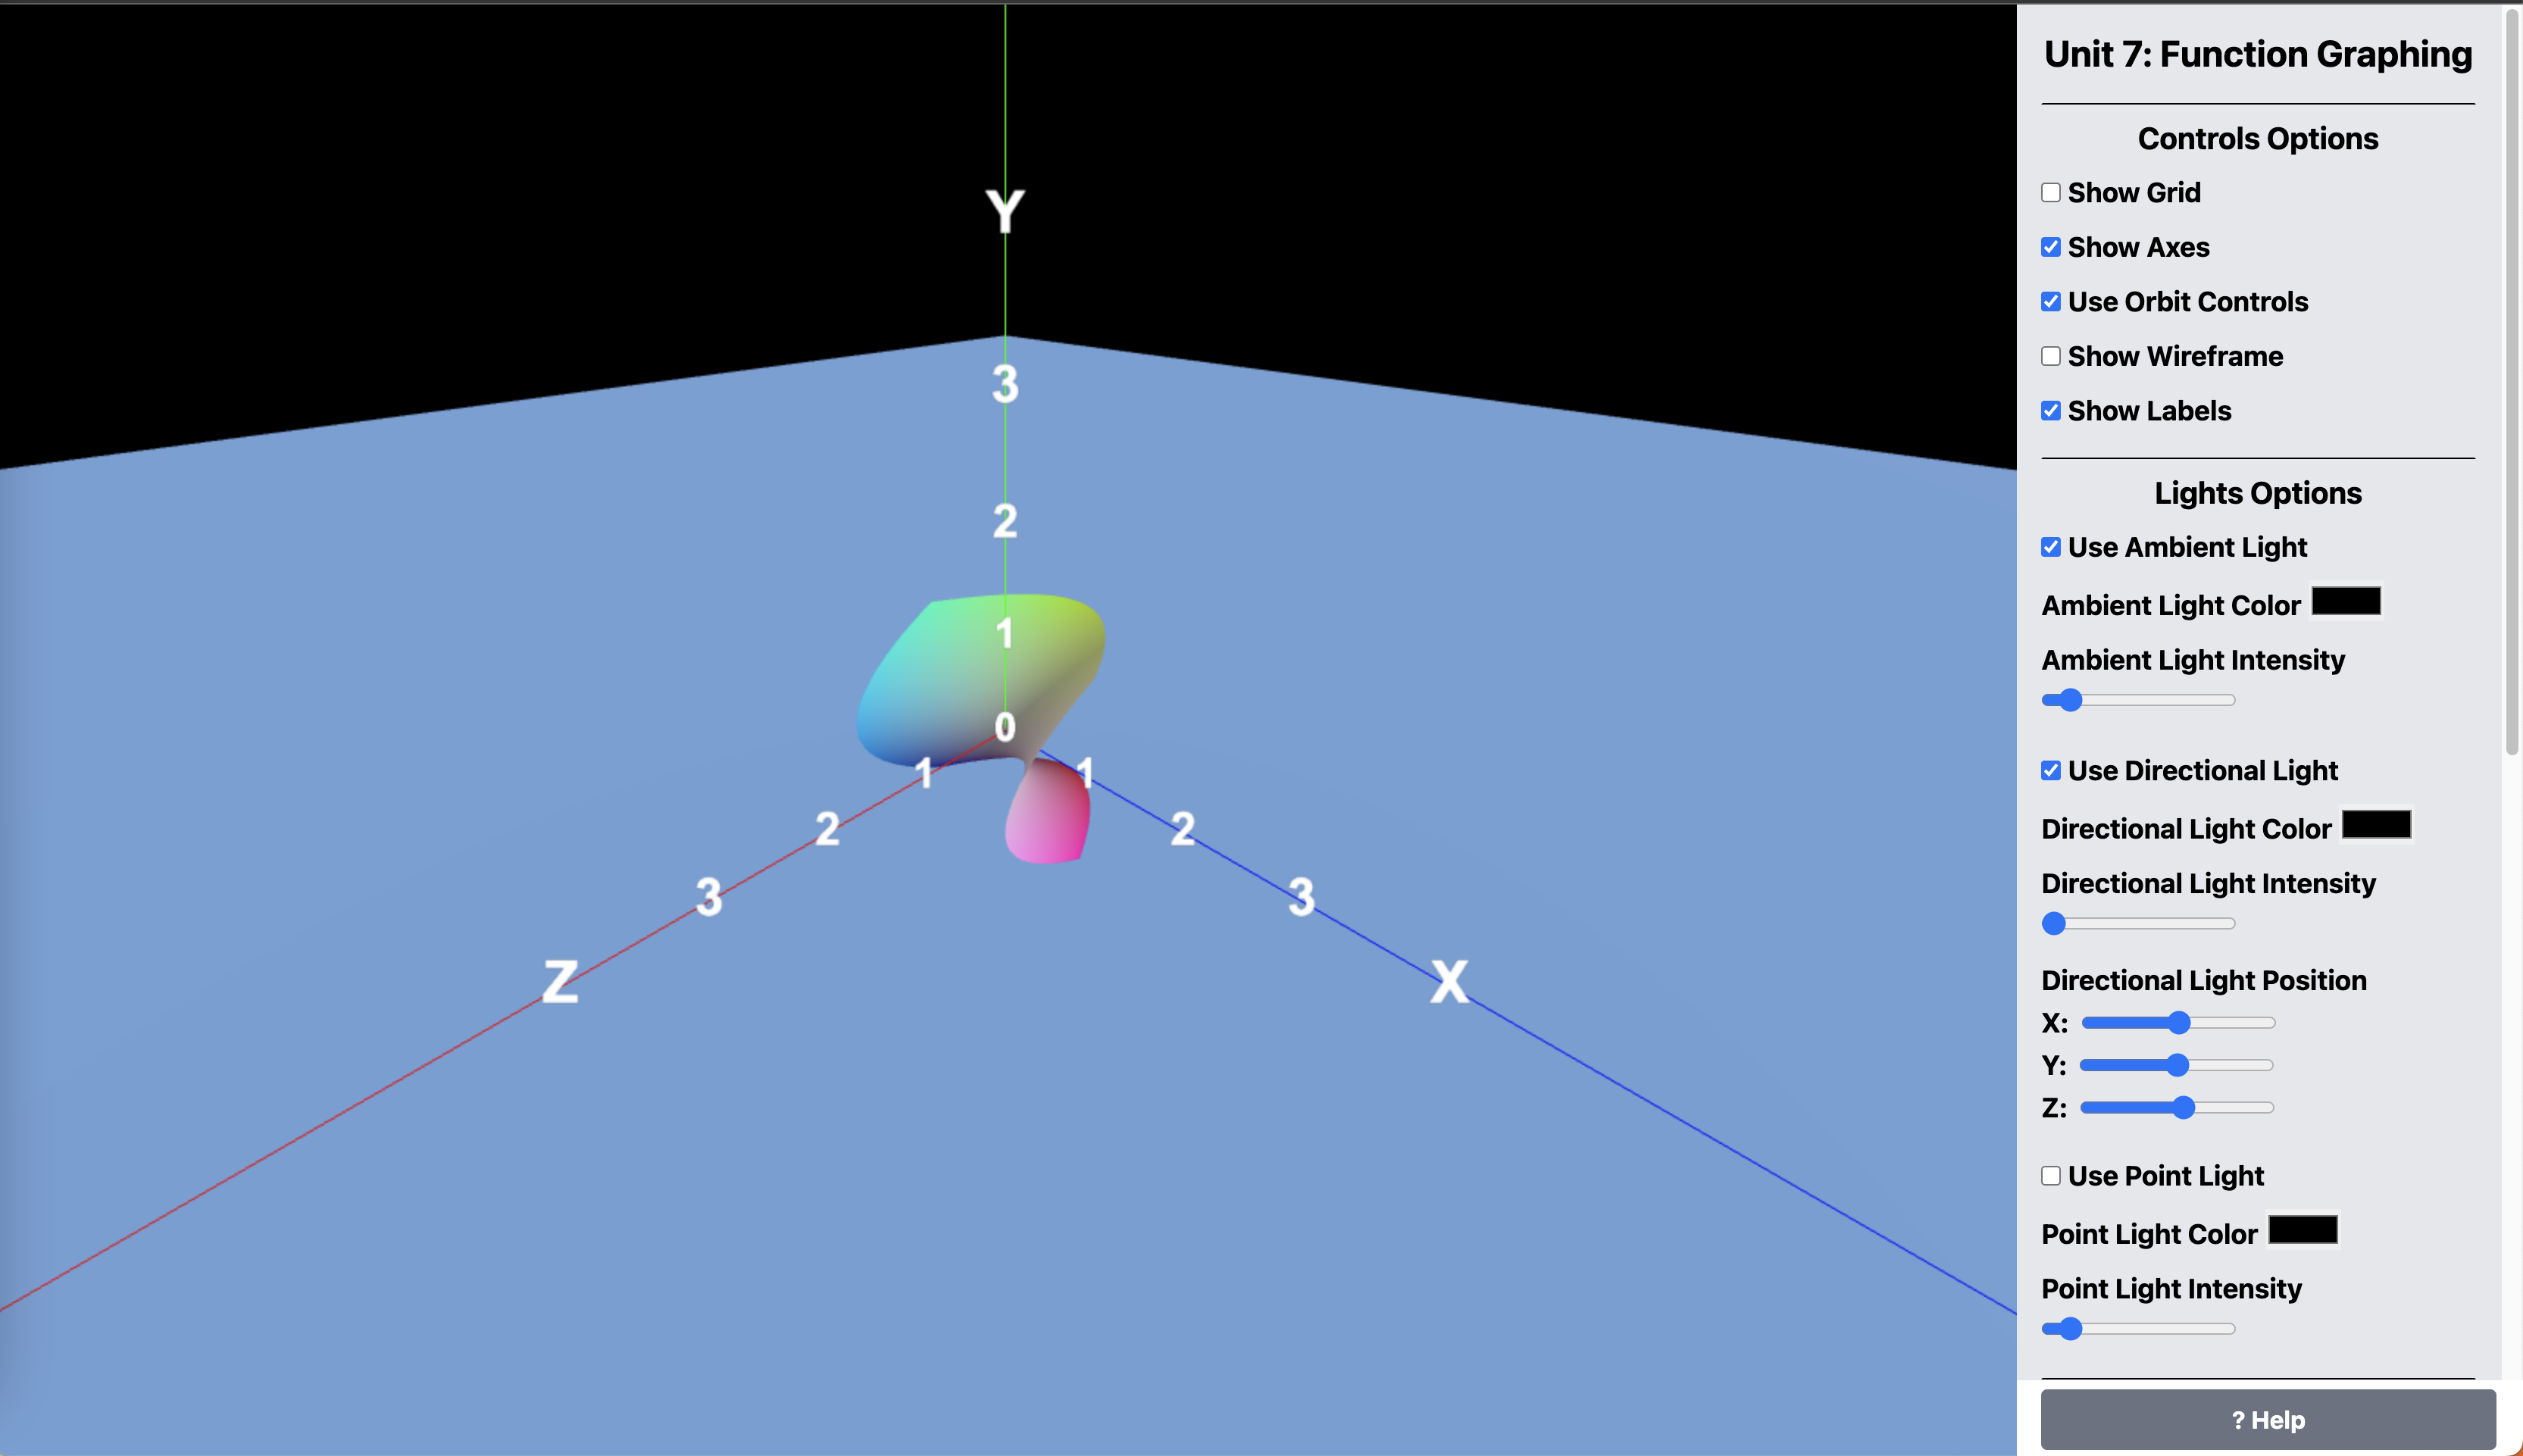
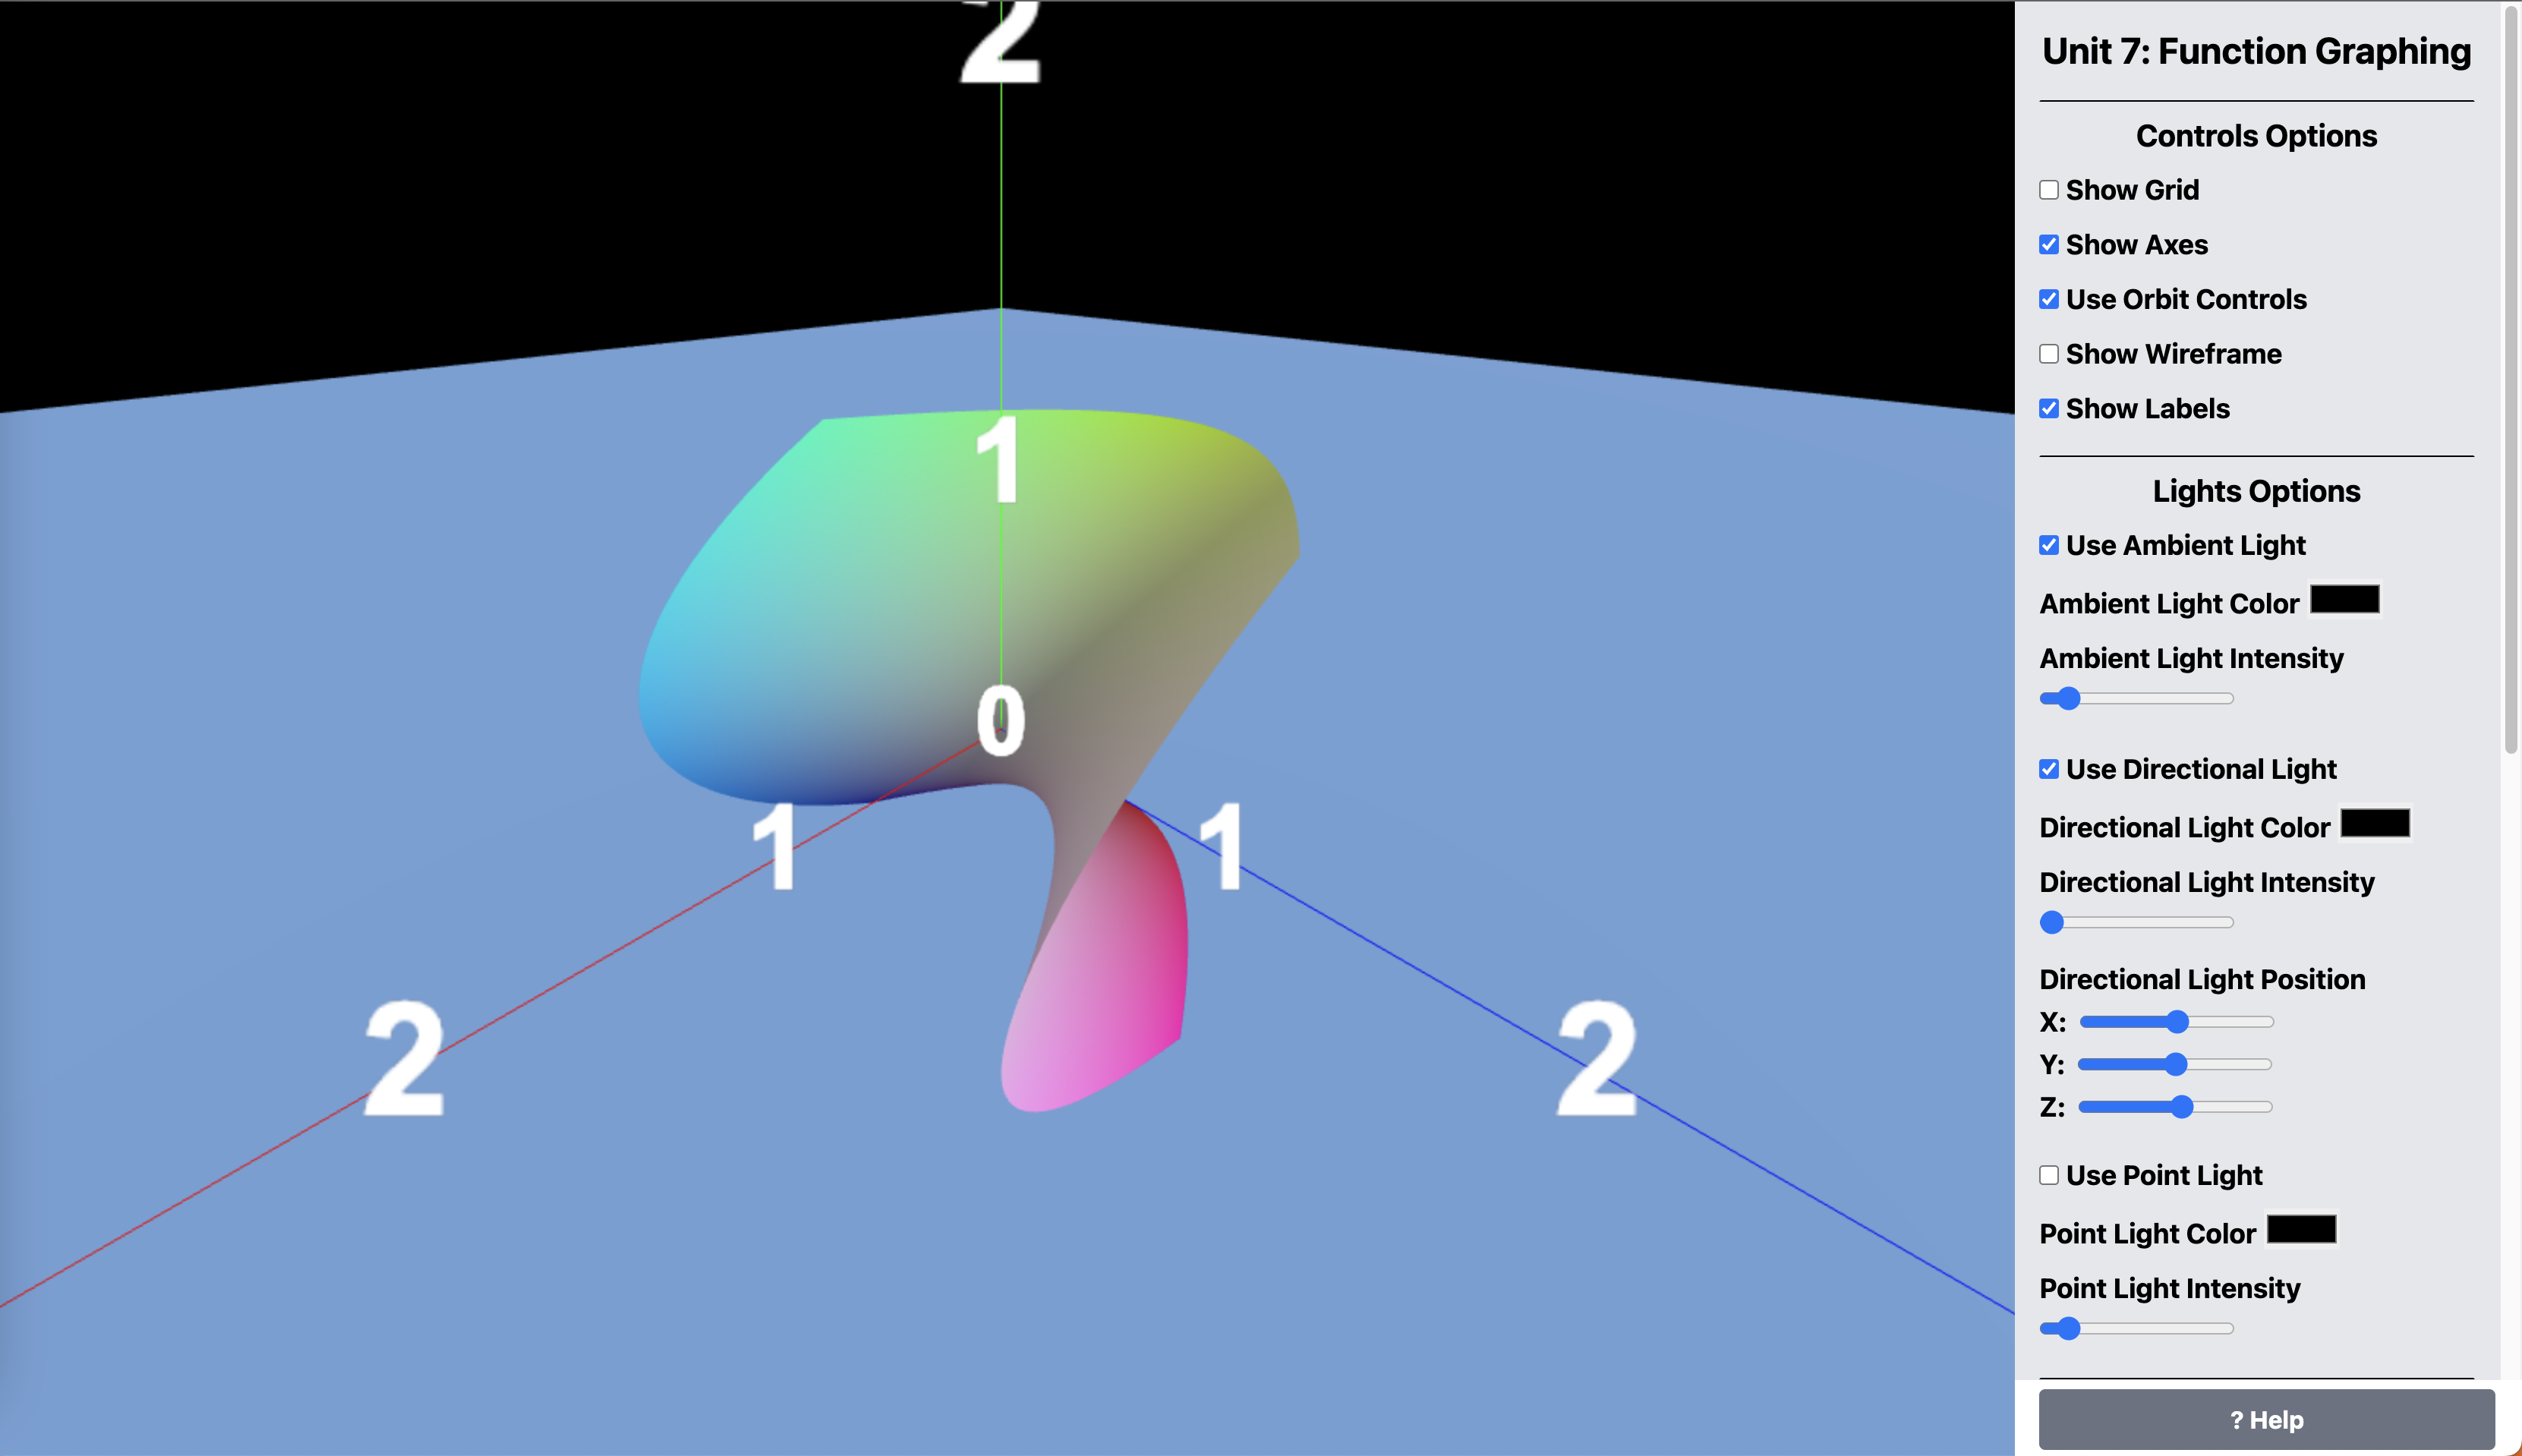
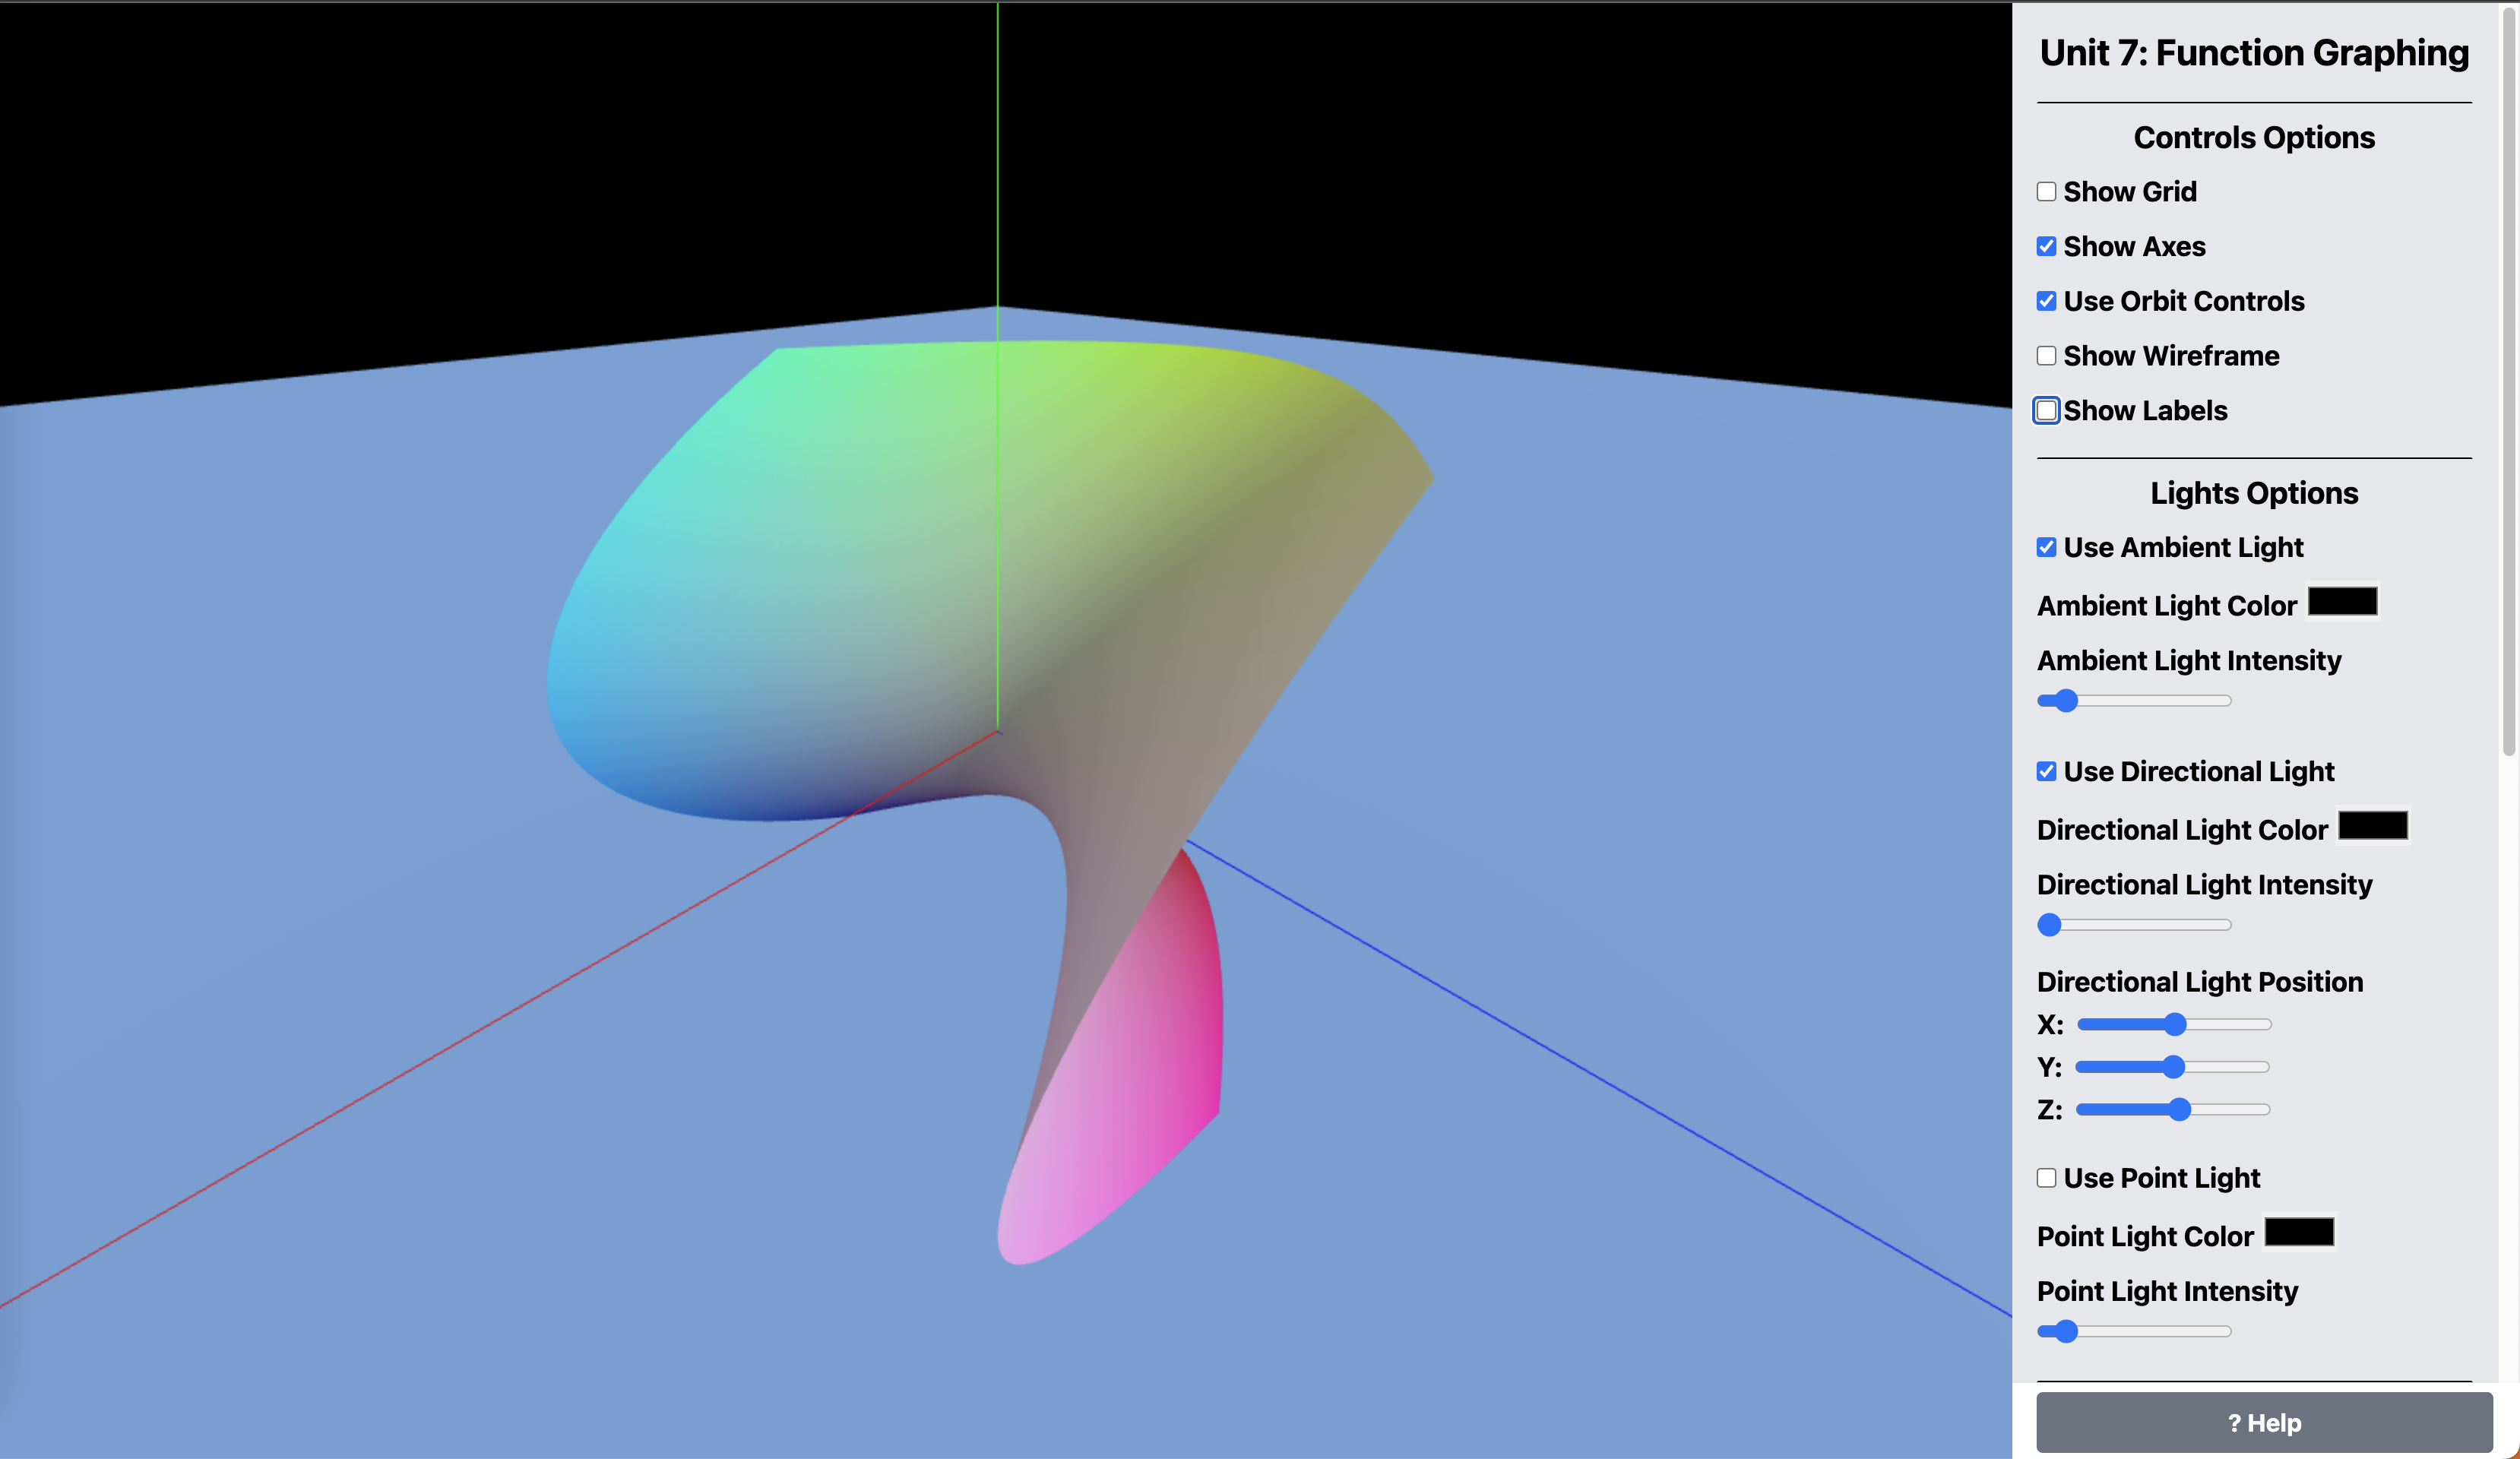
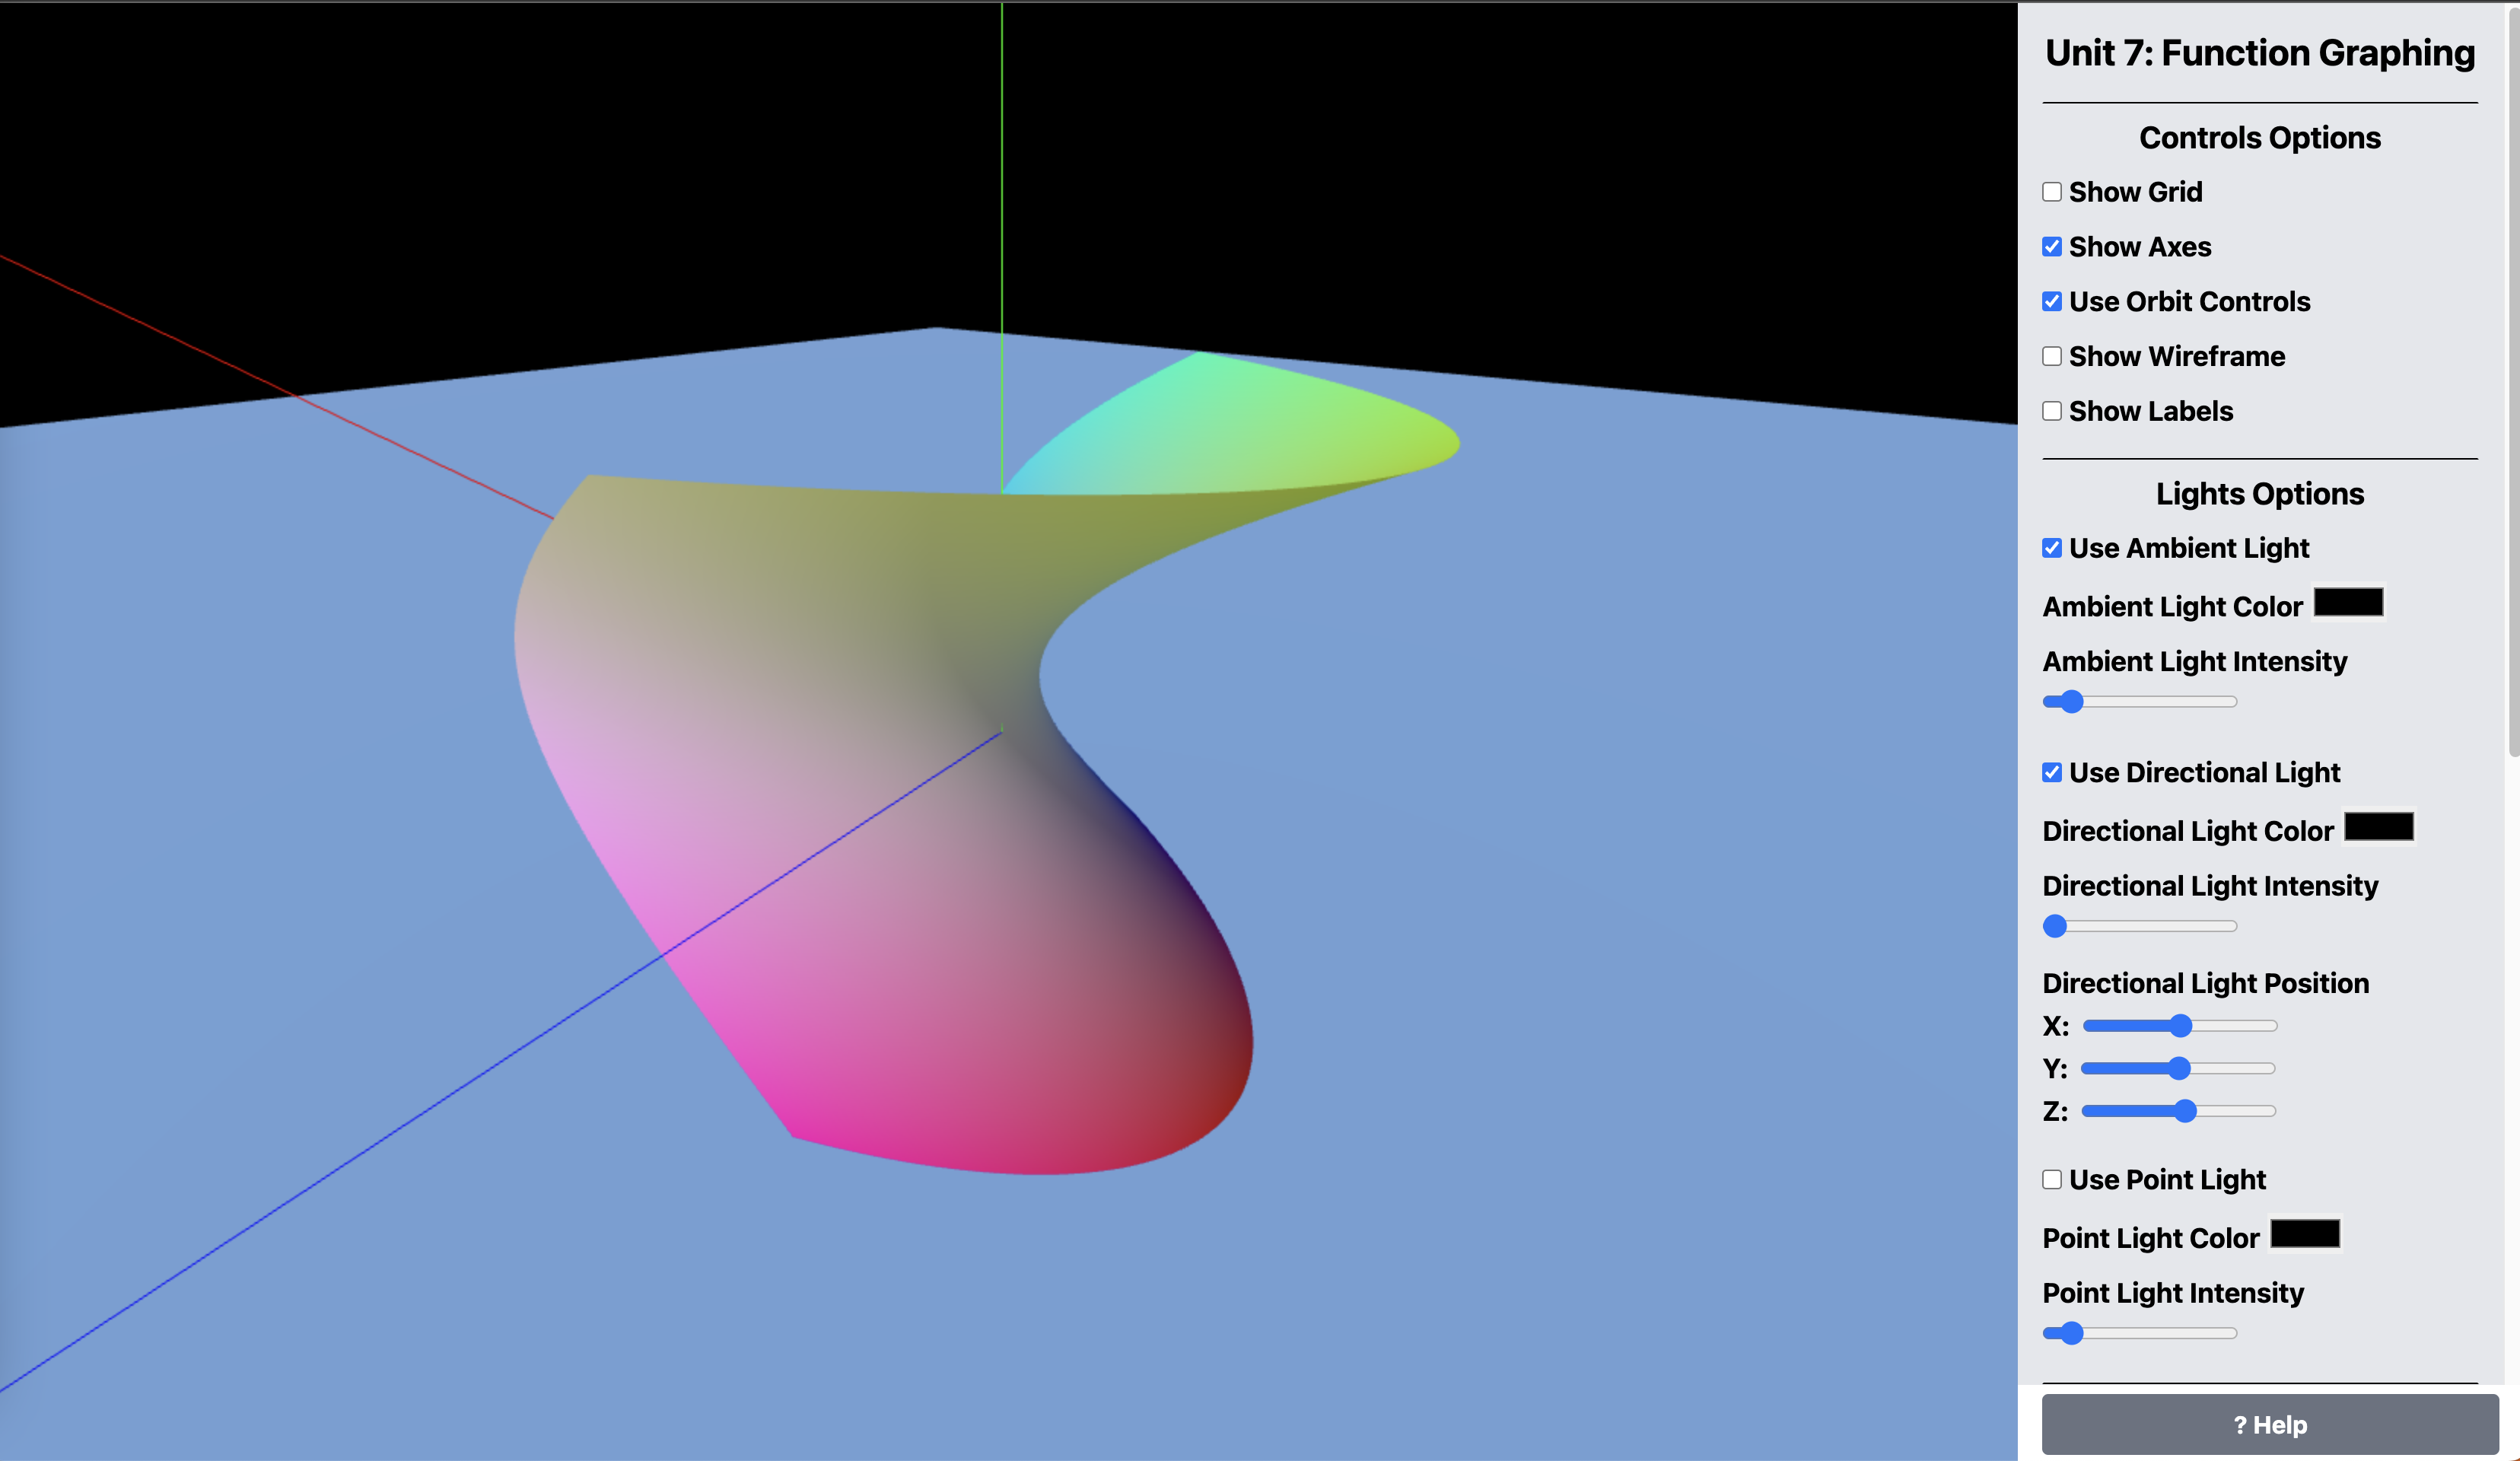
For this assignment, we created a 3D function graphing tool that expects a function in the form z=f(x,y), and it plots the function in 3D space. The program generates input values n between -1 and 1 in increments incr of .1 and uses this to plot x, y, and z vertices to be included as part of a mesh that is then graphically displayed.
Orbit controls are enabled on the scene along with options to control many things like lights, axis helpers, labels, and camera position. See the Options Panel section for more details. All n, incr, the function, ground color, and ground position can be controlled using the options panel.
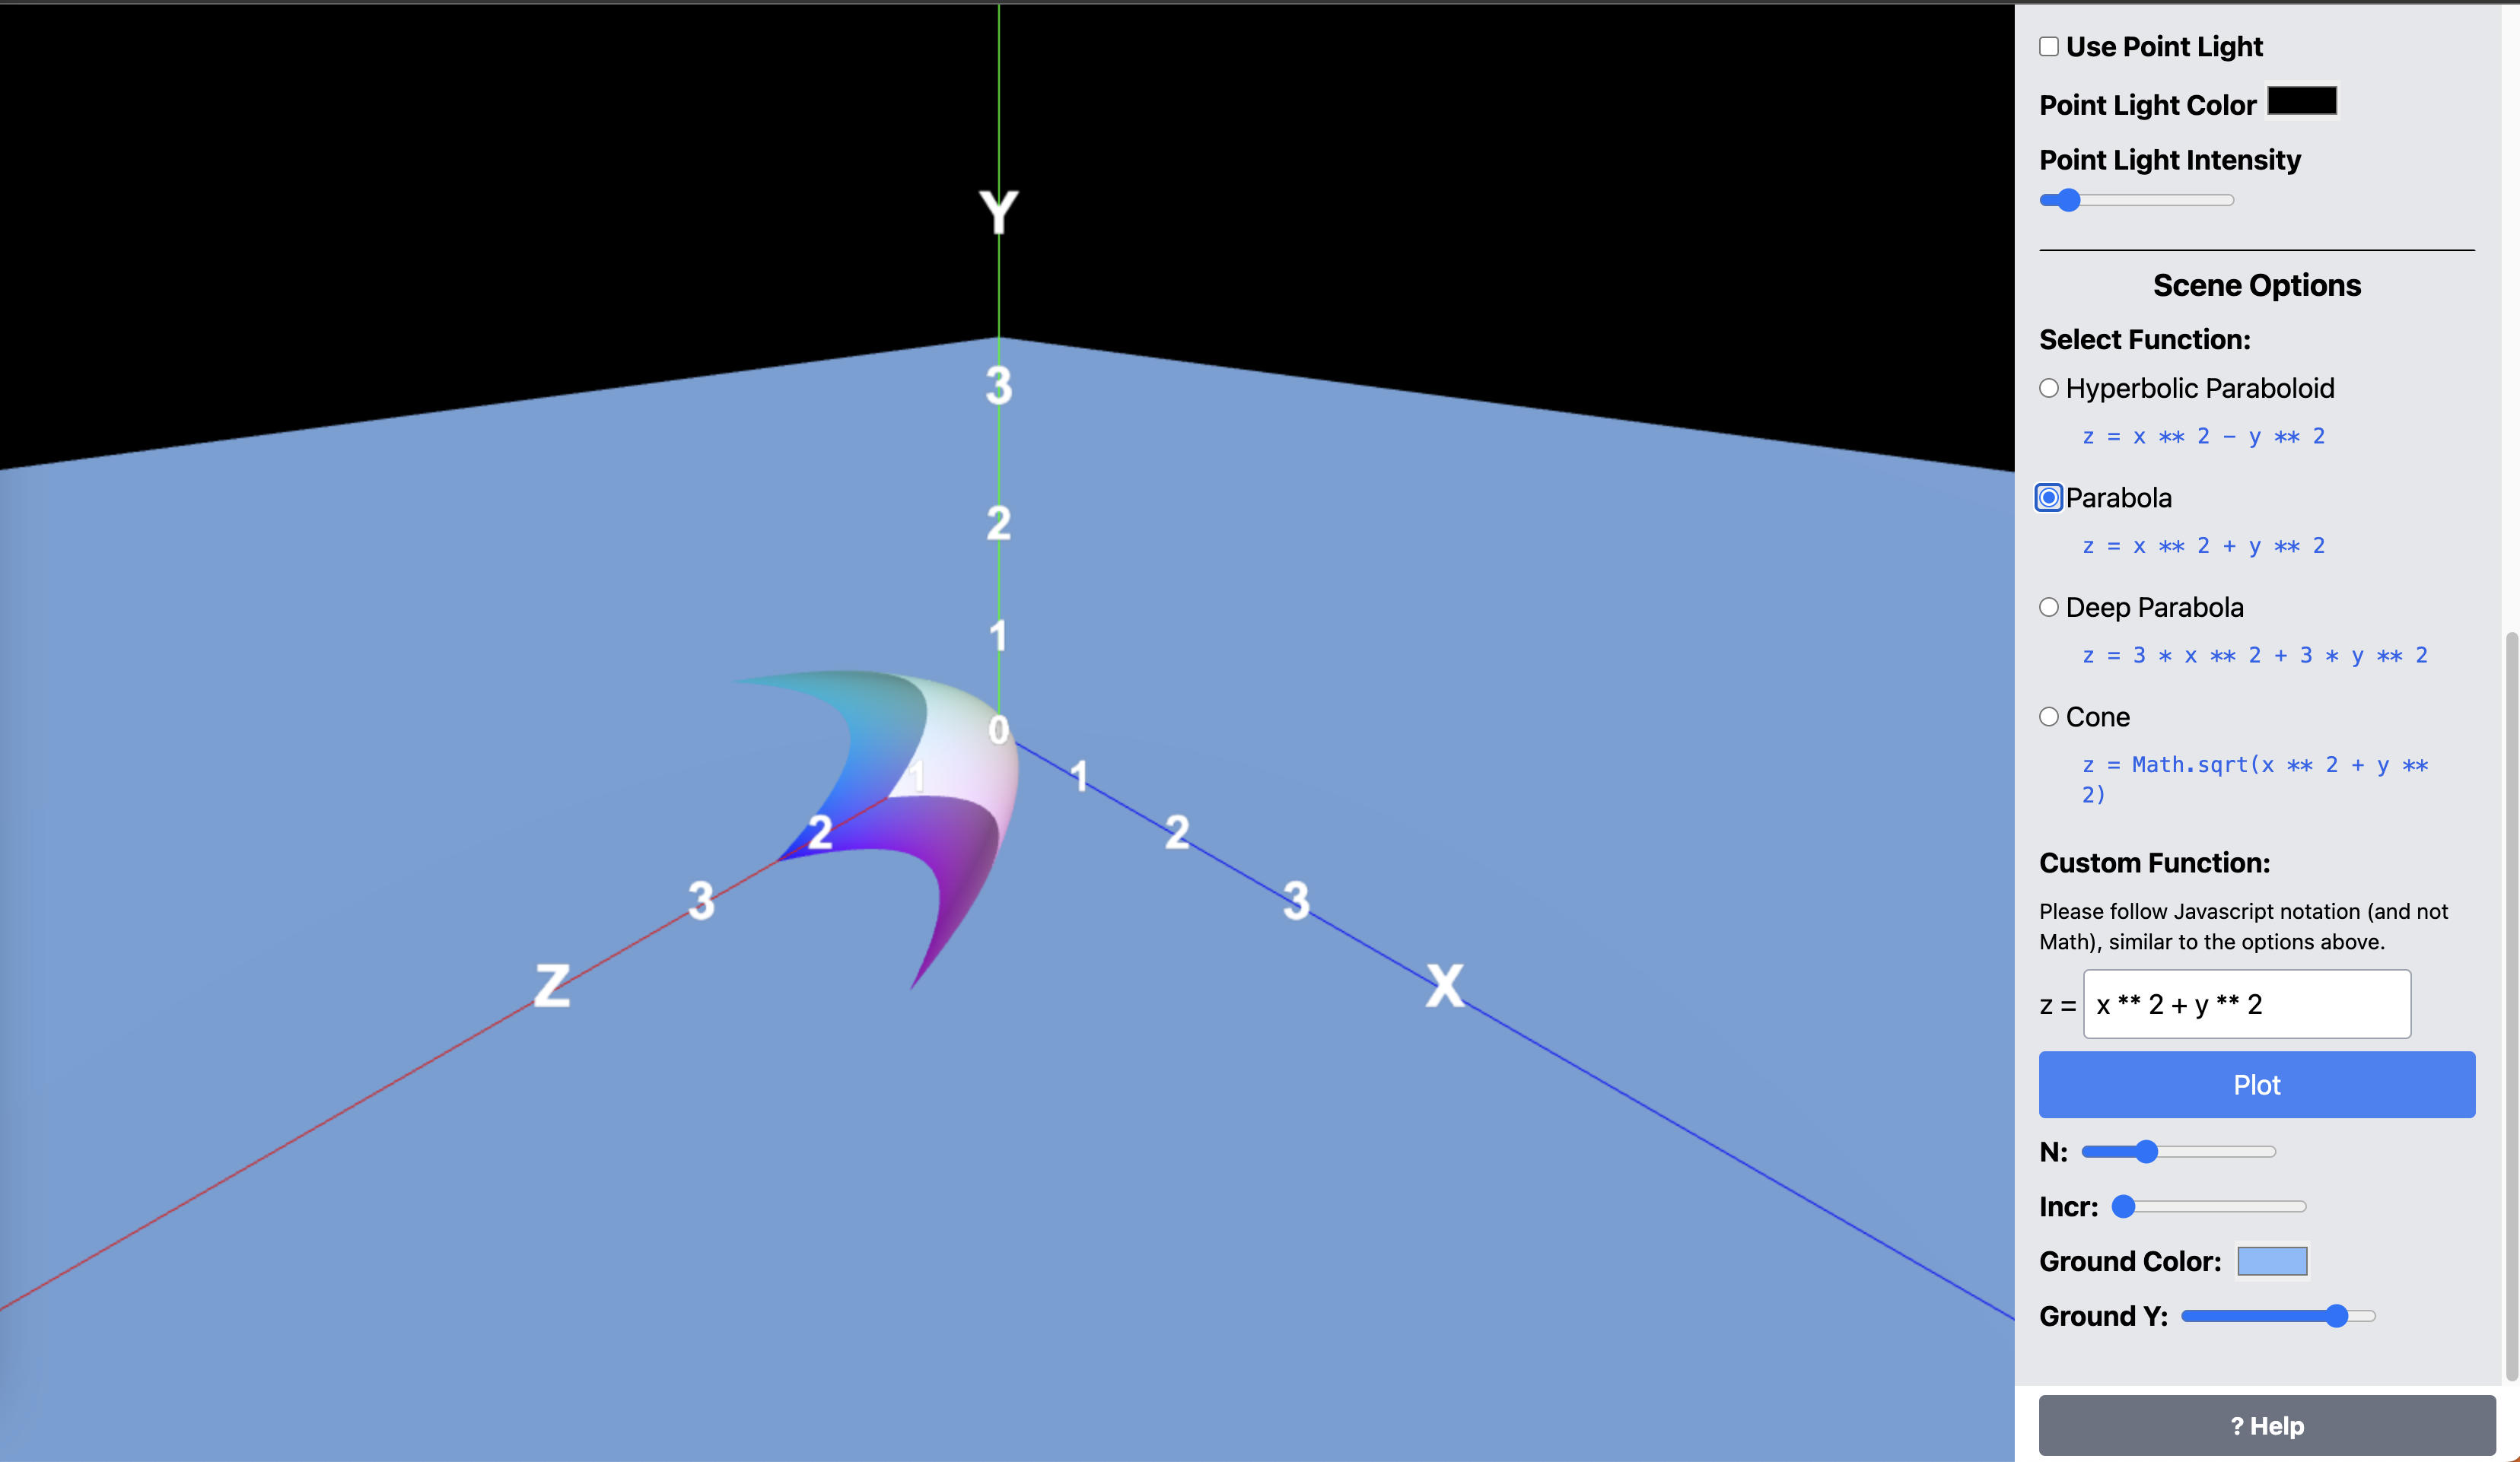
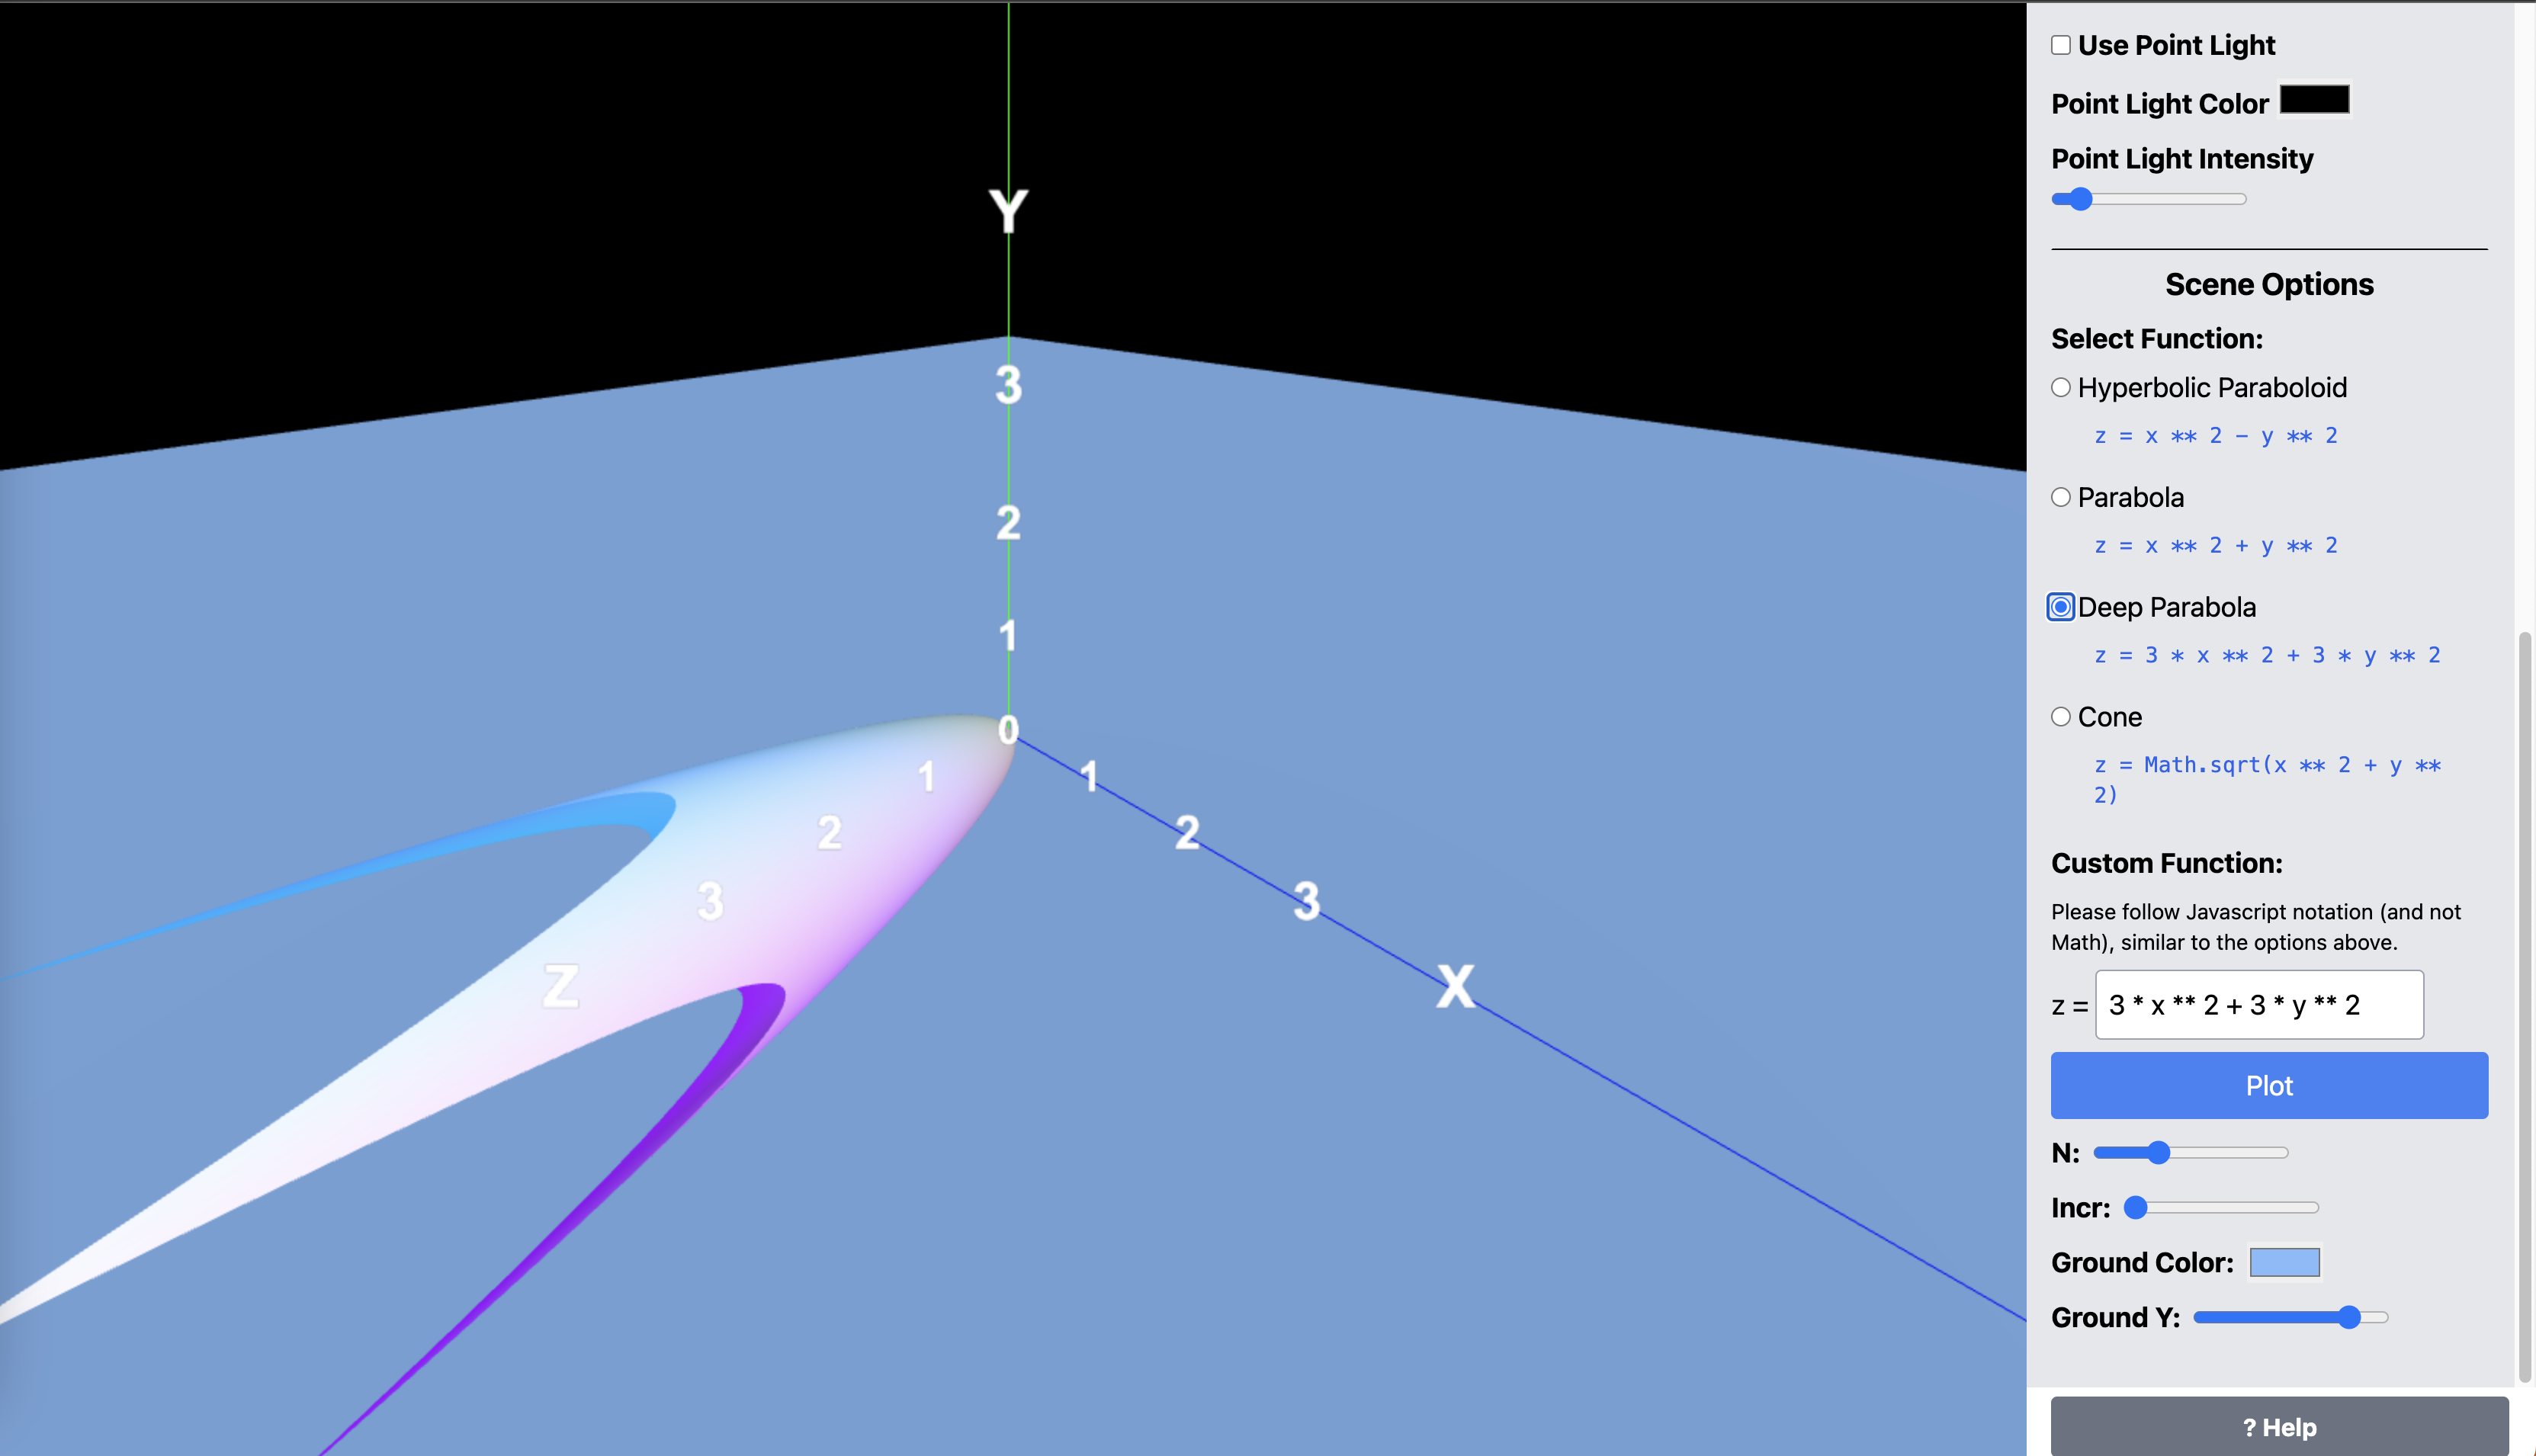
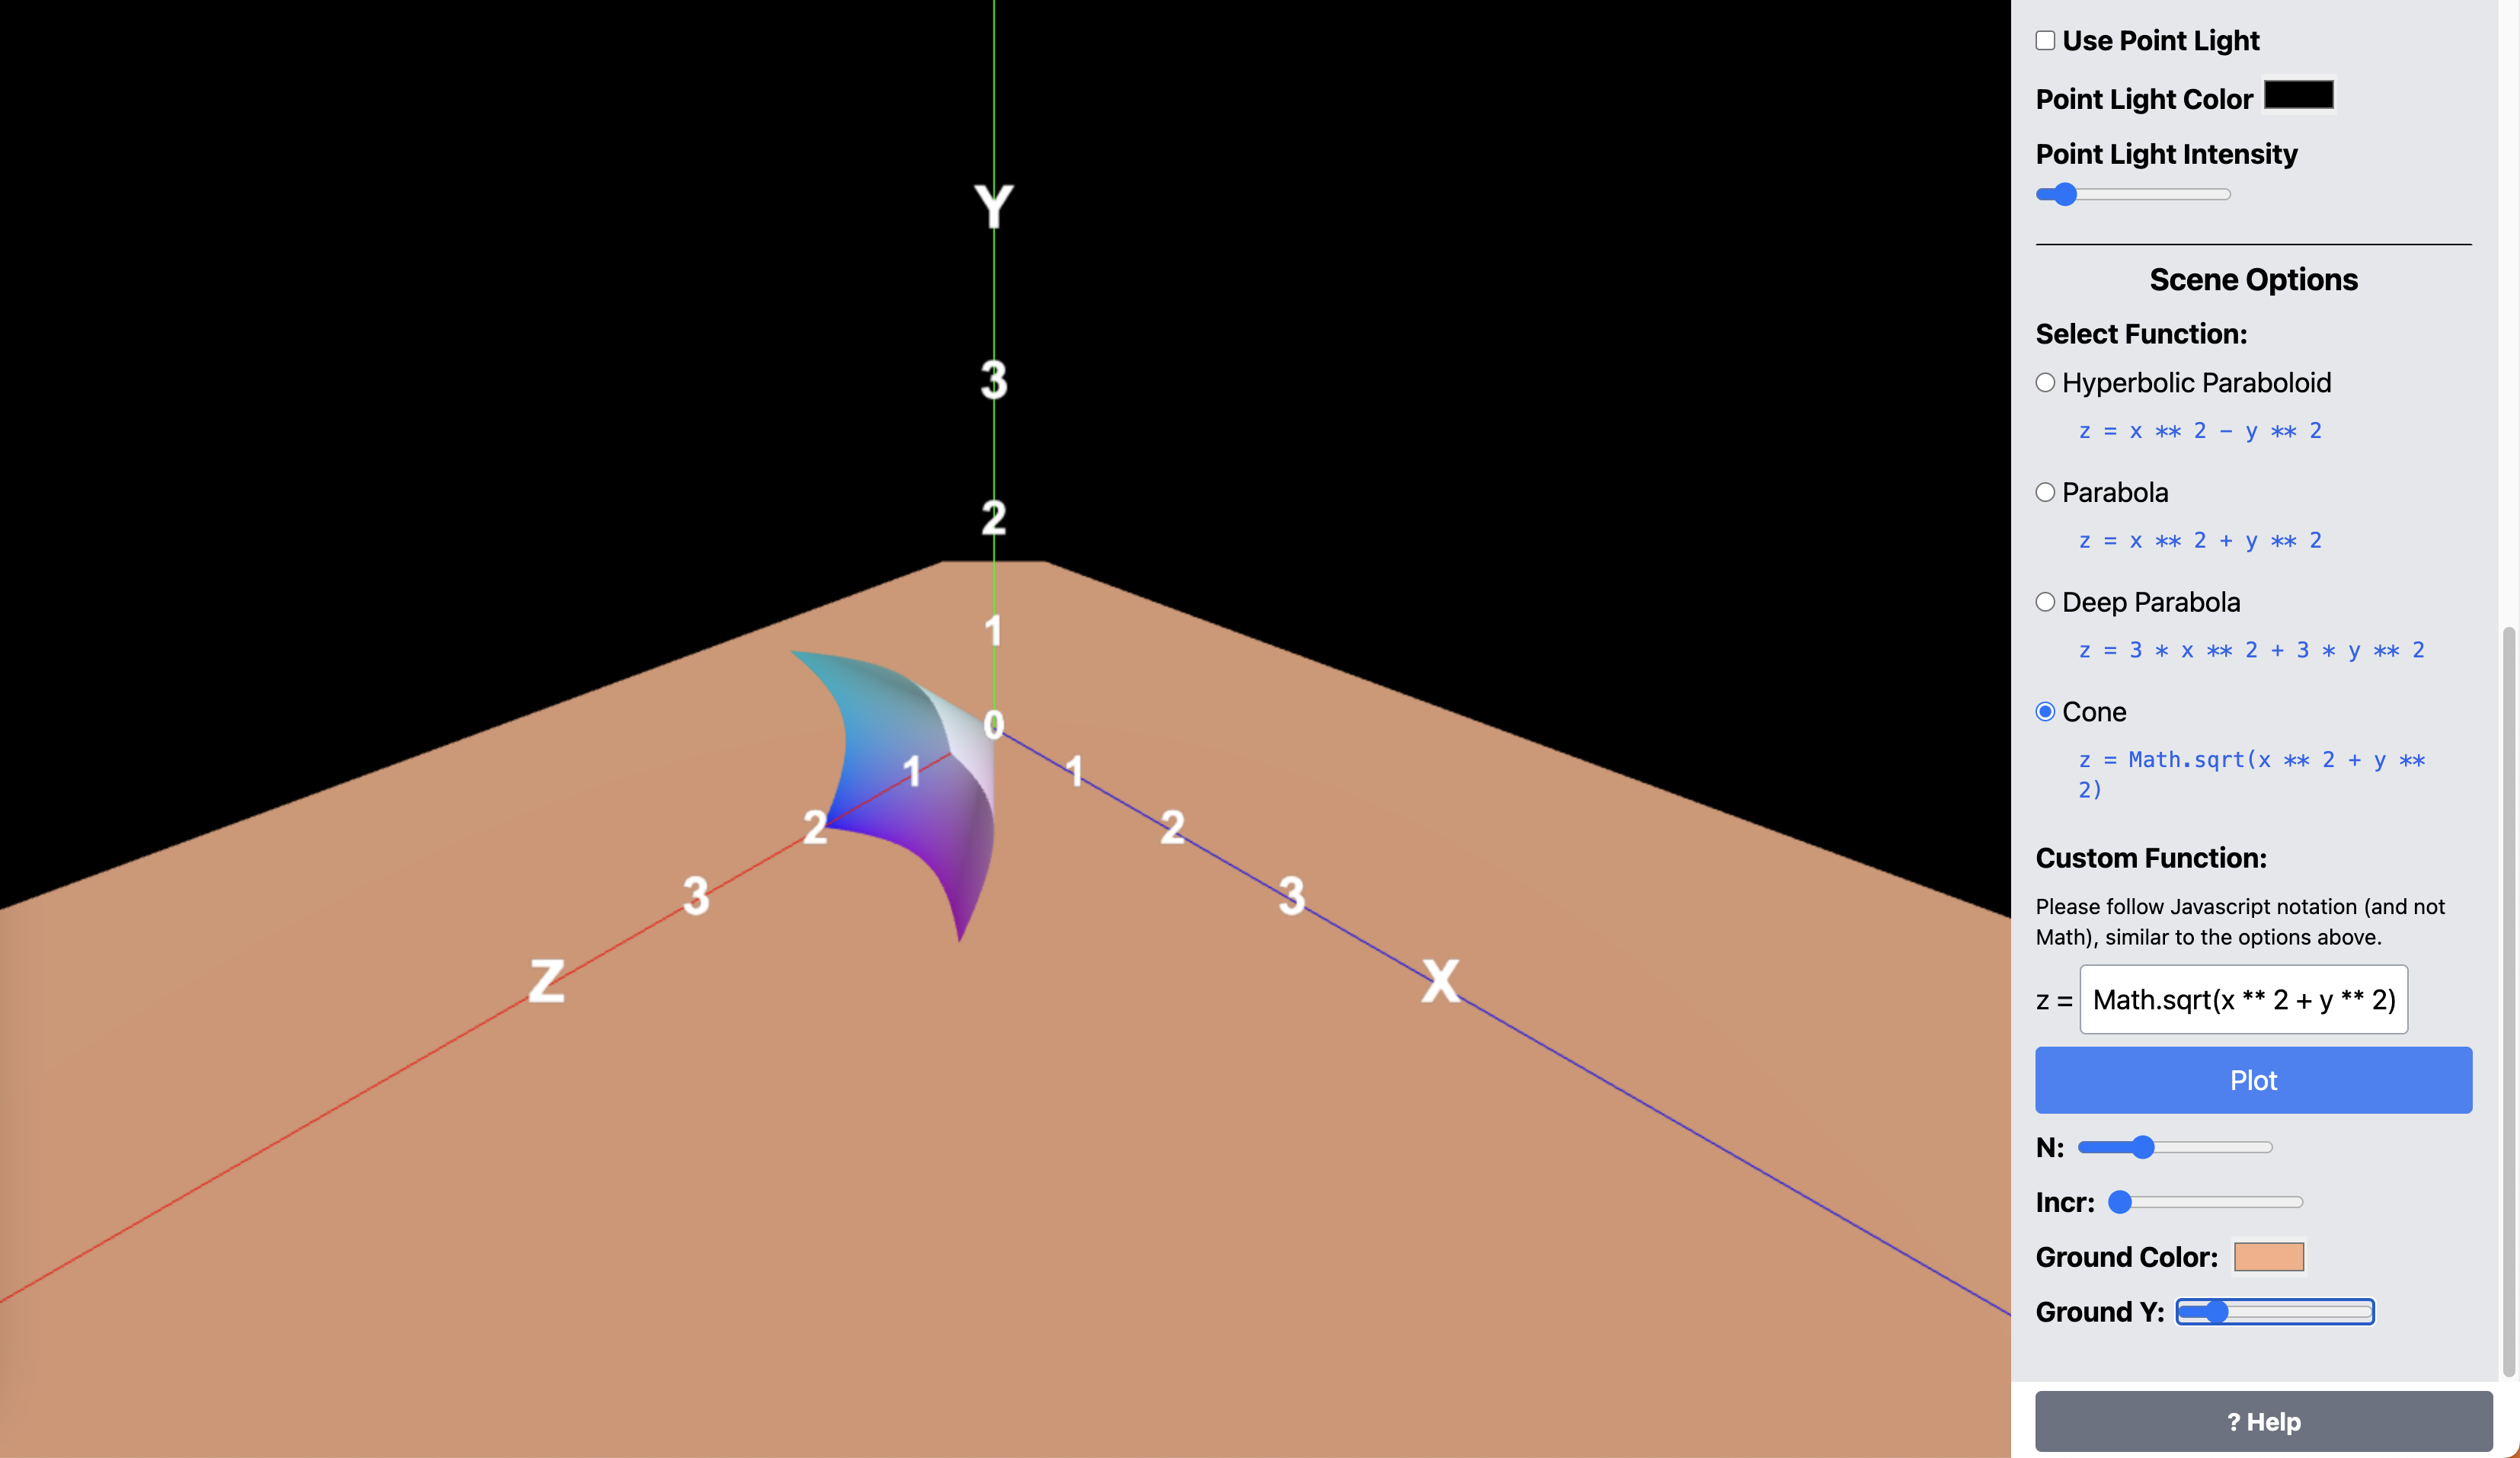
Images 1-7 show the program in action with different functions and options. Notice the Options Panel on the right side of the screen (Images 8-10 in the Options Panel section below).
The code below is the basic code for creating the graphing tool. The parts that create the options panel and the event listeners are included in the createBaseScene function, which I use for all my assignments.
import*asTHREEfrom"three";import{createBaseScene}from"../utils/createBaseScene";import{createTextSprite}from"../utils/createTextSprite";import{ParametricGeometry}from"three/examples/jsm/geometries/ParametricGeometry.js";/** * // n is used to control maxX, minX, maxY, minY values for the loop * Higher values makes the curve larger. * Good range is [1, 3] */letn=1;/** * // increment value for the loop (within plotFunction). * Higher values makes the curve more coarse. * Smaller values makes the curve more fine. * Good range is [0.01, 1] */letincr=0.01;const{camera,render,scene,shouldShowWireframe,sidebar,shouldShowLabels,renderer,directionalLight,canvas,addHelpNote}=createBaseScene({sceneTitle:"Unit 7: Function Graphing",cameraZ:n*15,cameraFov:90,defaultLightColor:"#fff",showAxes:true,showGrid:false,useAmbientLight:true,usePointLight:false,gridHelperSize:n*10,gridHelperDivisions:n*10*10,showWireframe:false,});// for easy access to the edges of the sceneconstsceneEdges={top:canvas.height/2,bottom:-canvas.height/2,left:-canvas.width/2,right:canvas.width/2,};// this is the signature of the function which will be used to compute the z valuetypeParsedFn=(x:number,y:number)=>number;/** * Takes a string representing the math operation to compute z value * and returns a function that can be used to compute the z value. * The function string comes from the user input, and will be parsed to a function definition. * see `defaultFunctions` for examples of a few predefined functions. */constparseFunction=(fn:string):ParsedFn=>{returnnewFunction("x","y",`return ${fn}`)asany;};/** * Generates a parametric function based on the parsed function. * This function will be used to generate the geometry of the curve. */constgenerateParametricFunction=(fn:ParsedFn)=>{constparametricFunction=(u:number,v:number,target:THREE.Vector3)=>{constx=(u-0.5)*2*n;// Map u from [0, 1] to [-n, n]consty=(v-0.5)*2*n;// Map v from [0, 1] to [-n, n]constz=fn(x,y);target.set(x,y,z);};returnparametricFunction;};//computes the size of the ground plane, to stay scaled with the curveconstgroundSize=(n:number)=>n*100;//computes the number of segments for the curveconstgetCurveSegments=(n:number,incr:number)=>Math.max(10,Math.floor((2*n)/incr));/** * Configure the ground plane. * - Assemble the geometry and material. * - Add the ground to the scene. * - Set the position and rotation to be prendicular to the curve. */constgroundGeometry=newTHREE.PlaneGeometry(groundSize(n),groundSize(n),10,10);constgroundMaterial=newTHREE.MeshStandardMaterial({color:"#84bbfa",side:THREE.DoubleSide,wireframe:false,opacity:0.5,});constground=newTHREE.Mesh(groundGeometry,groundMaterial);ground.rotation.x=Math.PI/2;ground.position.y=-n*5;scene.add(ground);/** * Setup the curve. * - Assemble the geometry and material. * - Add the curve to the scene. */constcurveGeometry=newTHREE.BufferGeometry();constcurveMaterial=newTHREE.MeshStandardMaterial({side:THREE.DoubleSide,flatShading:false,// Smooth surface appearancewireframe:shouldShowWireframe(),vertexColors:true,// Enable vertex colors,});constcurve=newTHREE.Mesh(curveGeometry,curveMaterial);scene.add(curve);/** * This where the actual curve is drawn. It edits the geometry of the curve. * It accepts a string representing the function to plot, parse it, and use it to compute z values. */constplotFunction=(fnString:string)=>{constfn=parseFunction(fnString);// guard against 0 values as they cause infinite loopsif(!n||!incr){alert("Please set N and Increment values.");return;}// setup a new parametric geometryconstparametricGeometry=newParametricGeometry(generateParametricFunction(fn),// Parametric function is generated based on the parsed functiongetCurveSegments(n,incr),getCurveSegments(n,incr));// Generate vertex colors based on positionconstpositions=parametricGeometry.getAttribute("position").array;constcolors:number[]=[];/** * For each vertex, * - Push three values into `positions` array representing (x, y, z) coordinates. * - Push three values into `colors` array representing (r, g, b) values based on the (x, y, z) coordinates. */for(leti=0;i<positions.length;i+=3){constx=positions[i]!;consty=positions[i+1]!;constz=positions[i+2]!;// Normalize coordinates to [0, 1] for RGB mappingconstr=(x+n)/(2*n);constg=(y+n)/(2*n);constb=(z+n)/(2*n);colors.push(r,g,b);}// Assign the color attribute to the geometryparametricGeometry.setAttribute("color",newTHREE.Float32BufferAttribute(colors,3)// RGB colors);curve.geometry.dispose();// free up memory of the previous geometrycurve.geometry=parametricGeometry;// assign the edited geometry to the curve// ensure that the ground plane is scaled with the curveground.geometry=newTHREE.PlaneGeometry(groundSize(n),groundSize(n),10,10);};/** * Handling shadows: * - configure necessary objects to cast and receive shadows. * - configure the directional light position and other properties. * - set the light source at the top right corner of the canvas. * - configure the shadow camera properties. */directionalLight.position.set(sceneEdges.right,sceneEdges.top,0);directionalLight.intensity=2;renderer.shadowMap.enabled=true;renderer.shadowMap.type=THREE.PCFSoftShadowMap;curve.castShadow=true;curve.receiveShadow=false;ground.castShadow=false;ground.receiveShadow=true;// shadow camera propertiesconstdlCameraFactor=2000;directionalLight.castShadow=true;directionalLight.shadow.camera.near=dlCameraFactor*0;directionalLight.shadow.camera.far=dlCameraFactor;directionalLight.shadow.camera.left=-dlCameraFactor;directionalLight.shadow.camera.right=dlCameraFactor;directionalLight.shadow.camera.top=dlCameraFactor;directionalLight.shadow.camera.bottom=-dlCameraFactor;/** * These are the default functions that the user can choose from. * They will be used to power the user input. */constdefaultFunctions=[{name:"Hyperbolic Paraboloid",fn:`x ** 2 - y ** 2`,// Saddle-shaped hyperbolic paraboloid.},{name:"Parabola",fn:`x ** 2 + y ** 2`,// A paraboloid (bowl shape).},{name:"Deep Parabola",fn:`3 * x ** 2 + 3 * y ** 2`,// A scaled paraboloid.},{name:"Cone",fn:`Math.sqrt(x ** 2 + y ** 2)`,// A cone with the vertex at (0, 0, 0).},]asconst;/** * A variable that is used to track if the function has changed. * If it is set to true the `plotFunction` is called in the next frame. * It is set to true when the user changes the function, * and then set to false after the function is plotted. */letfunctionChanged=true;letfnString=defaultFunctions[0].fnasstring;/** * Animation loop * - Animate the scene. * - Update the materials and labels based on the user's choice. * - If the function has changed, plot the new function, and set the flag to false. */constanimate=()=>{if(functionChanged){plotFunction(fnString);functionChanged=false;}requestAnimationFrame(animate);render();};animate();
The code itself is well documented. Follow code comments for better explanation.
The createBaseScene function is used to create the basic scene setup. It returns many variables to the caller, including render, renderer, scene, camera, controls, lights, and other GUI helpers.
The user can input a function in the form z=f(x,y) by selecting one of the predefined functions or entering a custom function.
The function string (from input) is then parsed into a function that can be used to compute the z value using the parseFunction function.
The generateParametricFunction function generates a parametric function based on the parsed function.
The plotFunction function is used to draw the curve. It accepts a string representing the function to plot, parses it, and uses it to compute z values.
The ground plane is configured to be perpendicular to the curve and is scaled with the curve.
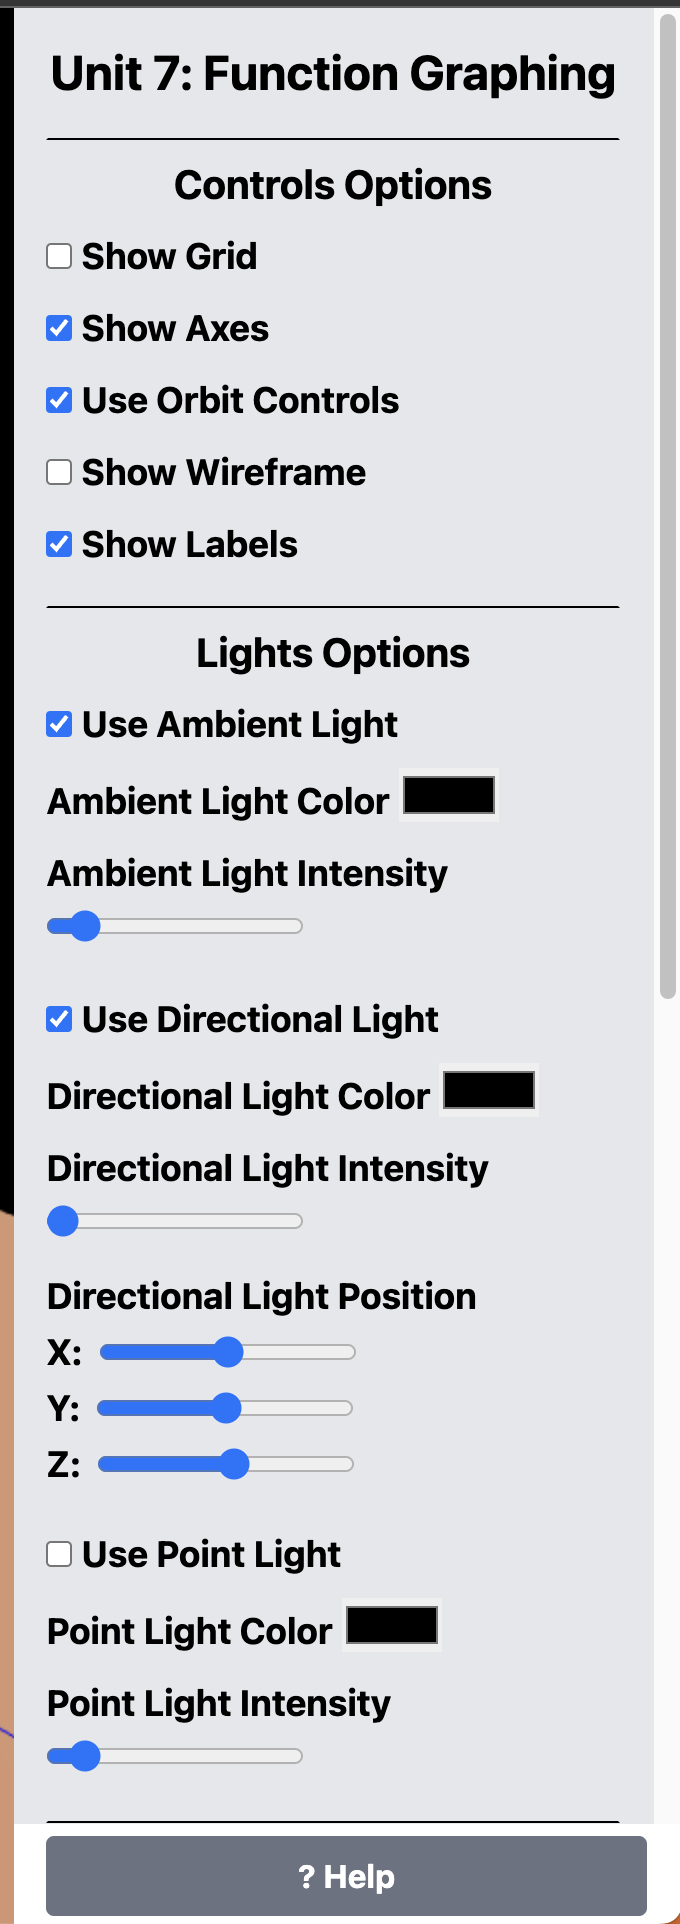
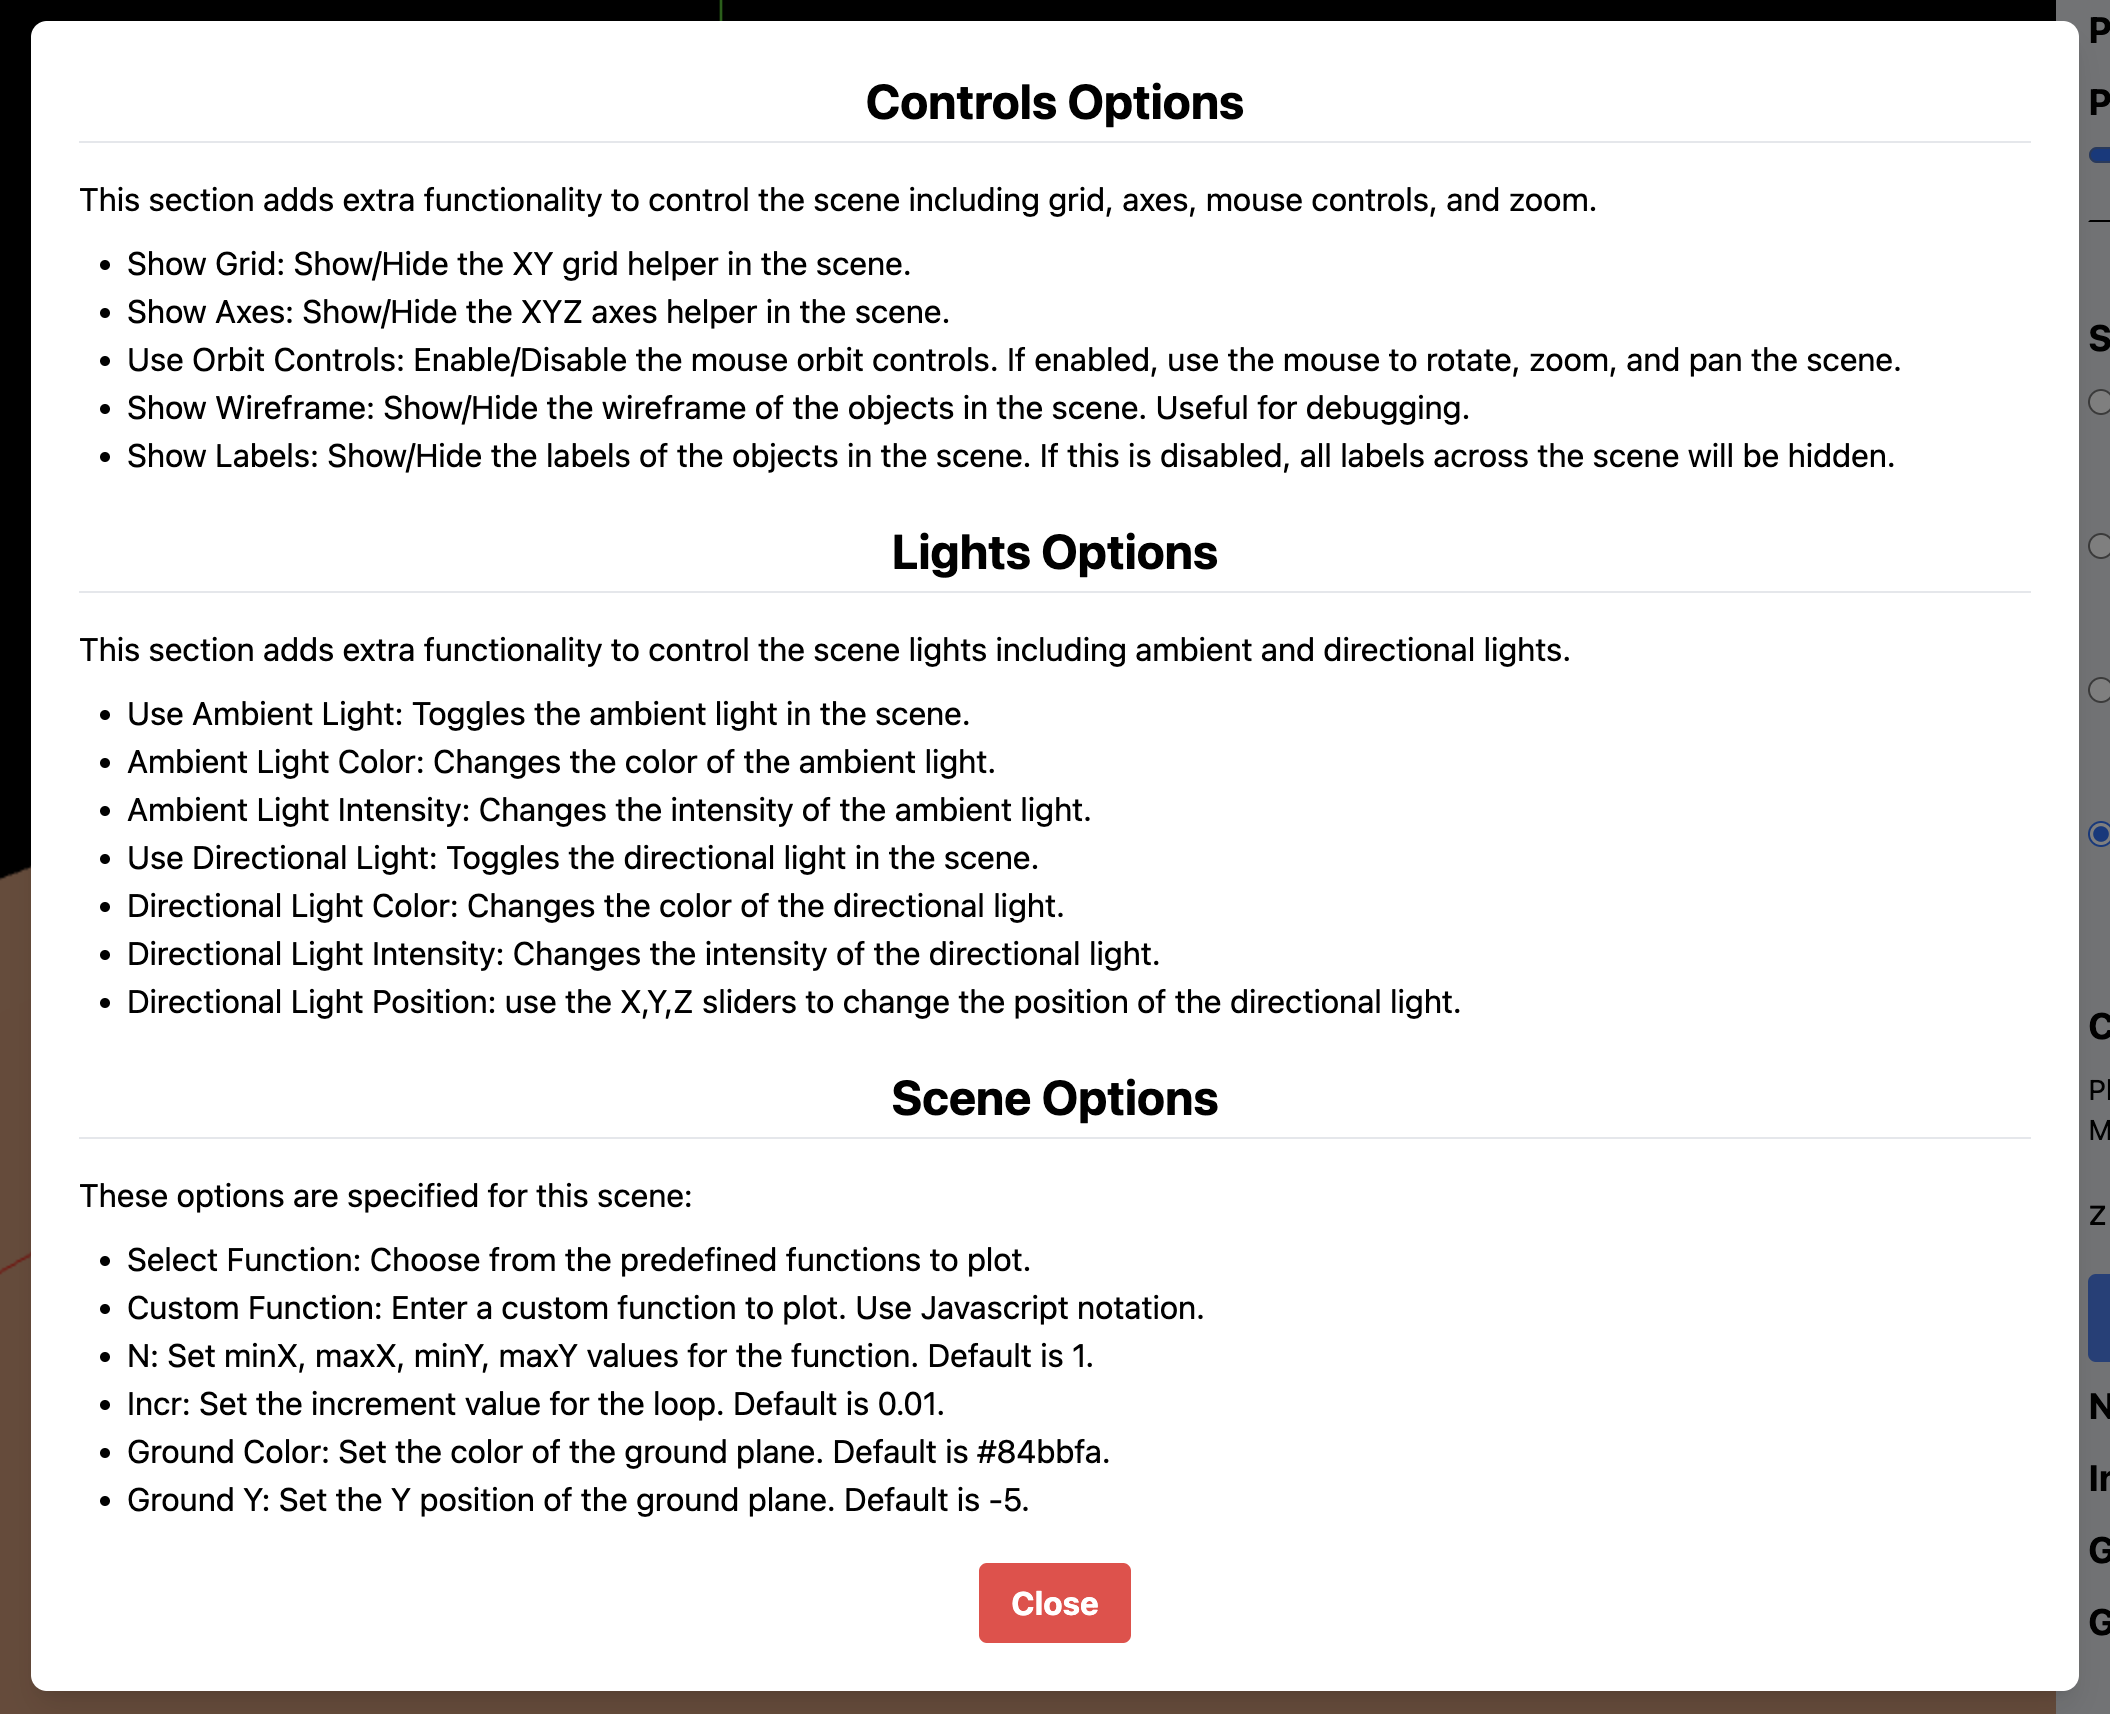
The Options Panel is a GUI panel lies on the right side of the screen. It contains the following options (see images 8-10 below), and the explanation of each option is as follows (Image 10) and can be displayed by clicking the Help button at https://ahmad-ali14.github.io/AY2025-T2-CS4406/unit7/: